8 Univariate distribution checks
This section reports a series of univariate summary checks of the bacteremia dataset.
8.1 Data set overview
Using the Hmisc describe function, we provide an overview of the data set. The descriptive report also provides histograms of continuous variables. For ease of scanning the information, we group the report by measurement type.
8.1.1 Demographic variables
2 Variables 14691 Observations
AGE: Patient Age years

| n | missing | distinct | Info | Mean | Gmd | .05 | .10 | .25 | .50 | .75 | .90 | .95 |
|---|---|---|---|---|---|---|---|---|---|---|---|---|
| 14691 | 0 | 85 | 1 | 56.17 | 20.78 | 24 | 29 | 43 | 58 | 70 | 79 | 84 |
SEX: Patient sex 1=male, 2=female
| n | missing | distinct | Info | Mean | Gmd |
|---|---|---|---|---|---|
| 14691 | 0 | 2 | 0.73 | 1.419 | 0.4869 |
 Value          1     2
 Frequency   8536  6155
 Proportion 0.581 0.419
8.1.2 Structural covariates and key predictors
7 Variables 14691 Observations
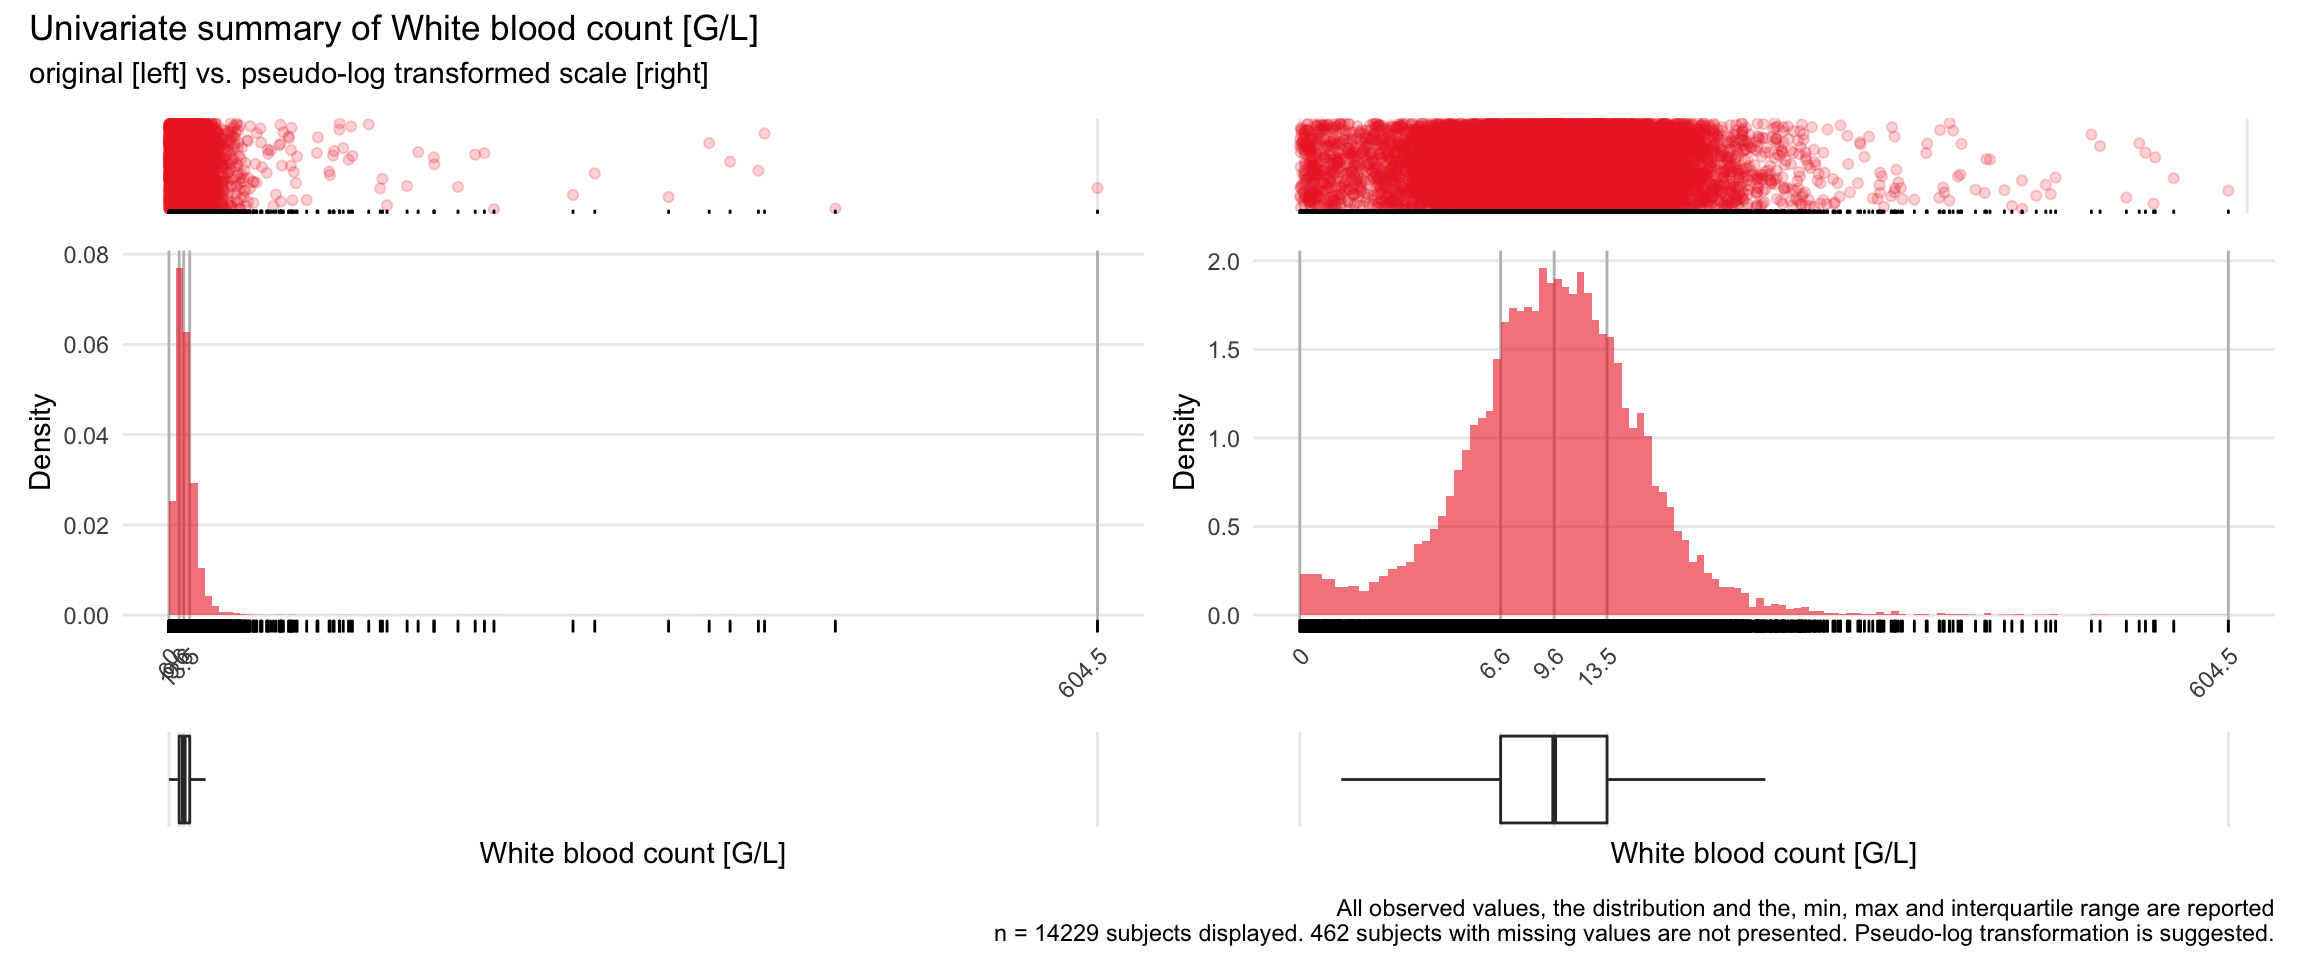
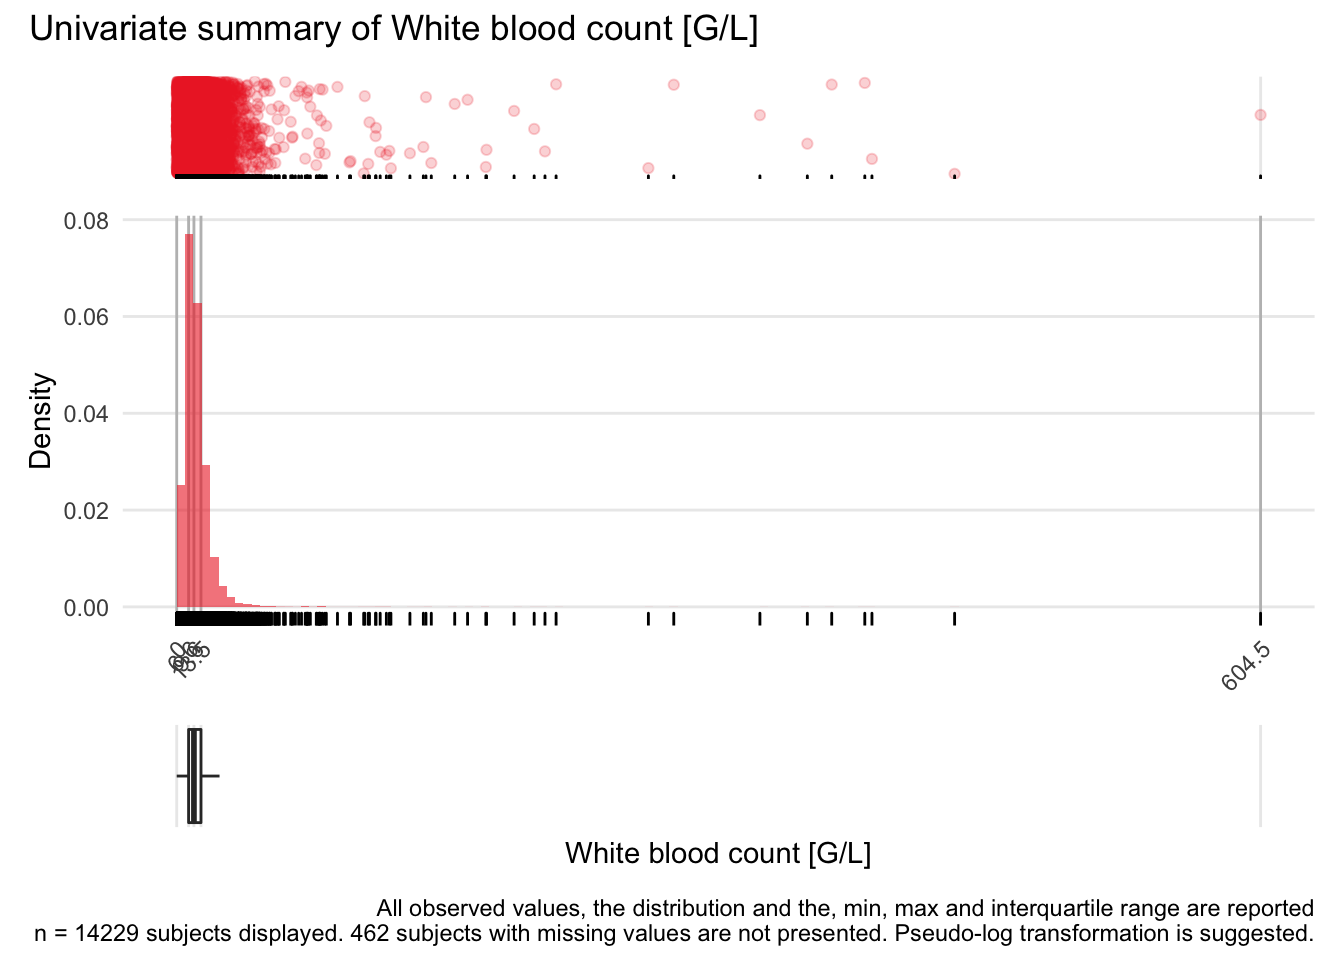
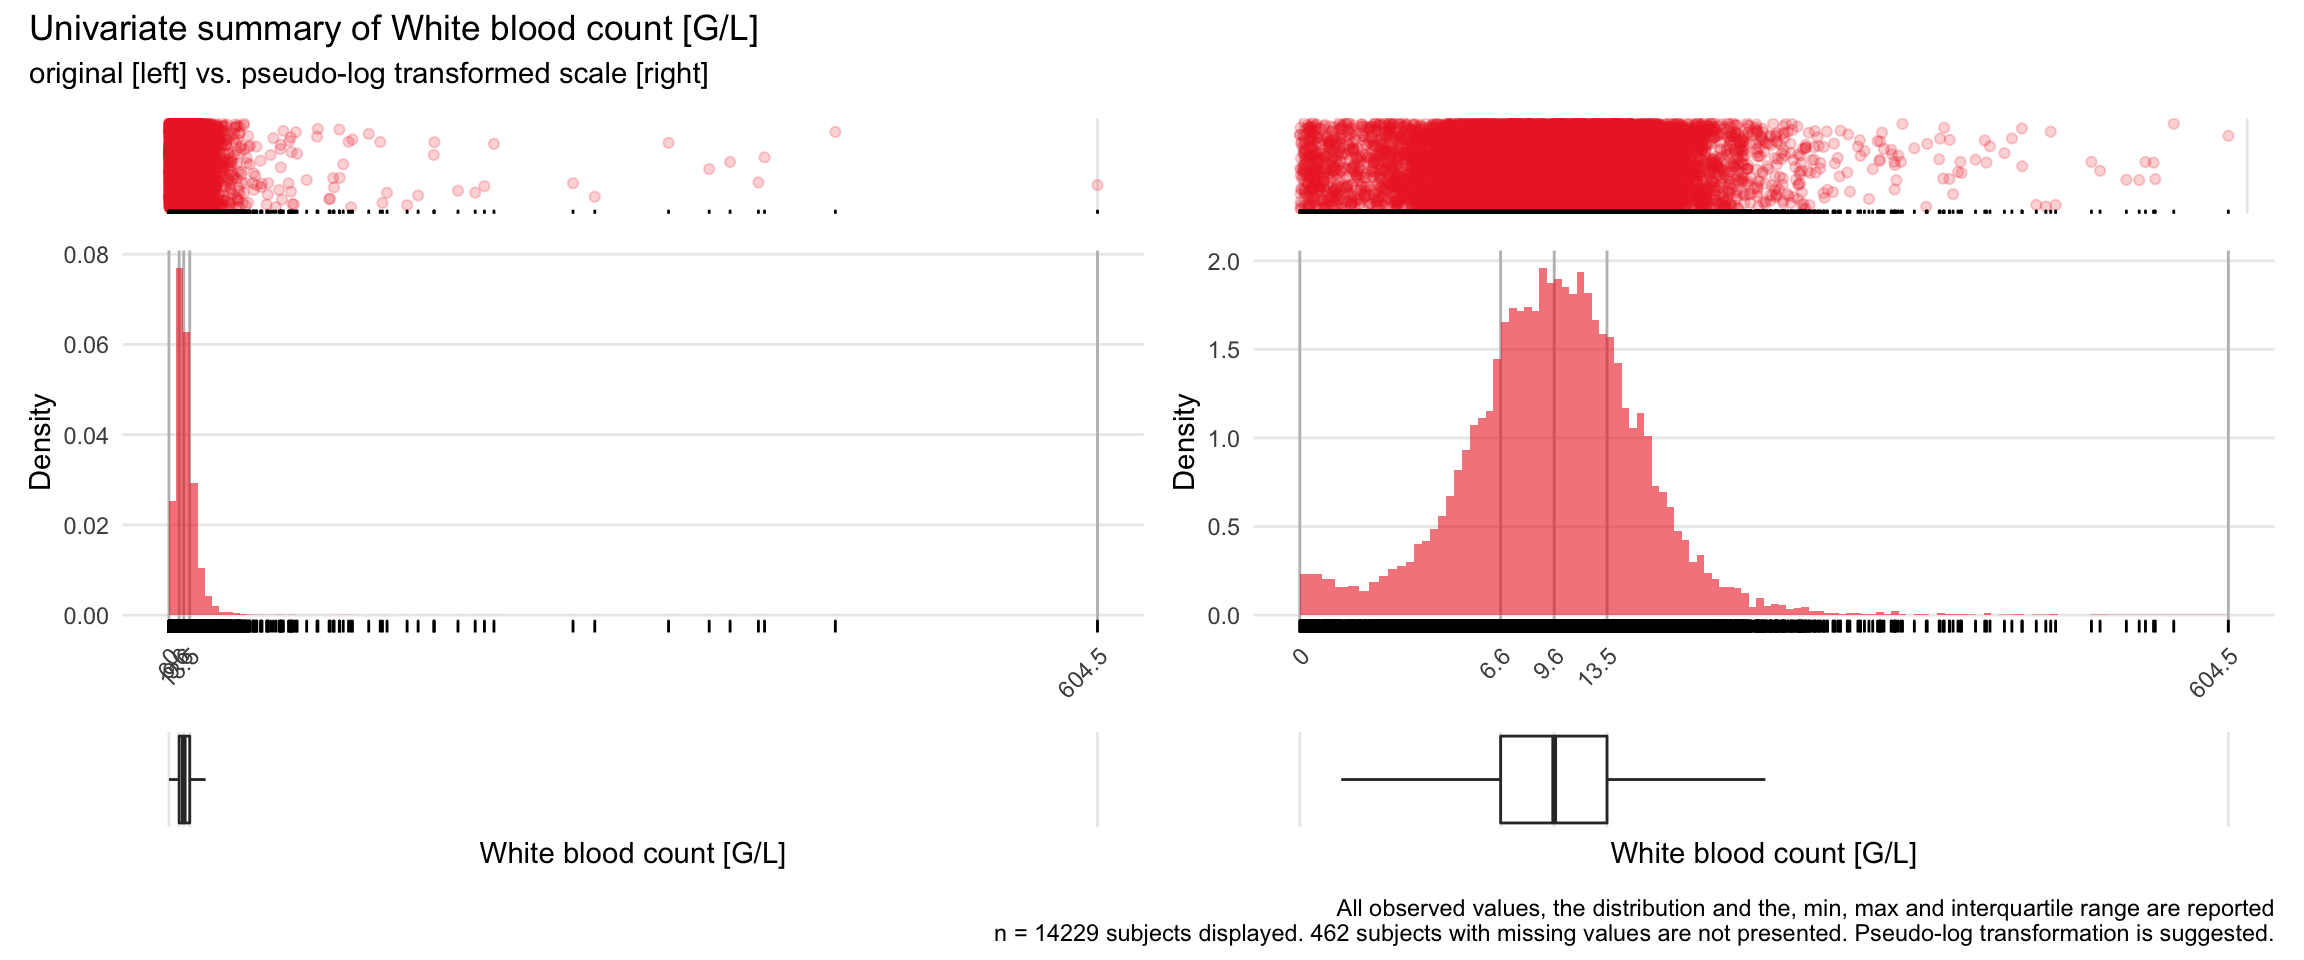
WBC: White blood count G/L

| n | missing | distinct | Info | Mean | Gmd | .05 | .10 | .25 | .50 | .75 | .90 | .95 |
|---|---|---|---|---|---|---|---|---|---|---|---|---|
| 14229 | 462 | 2710 | 1 | 11.23 | 7.602 | 2.66 | 4.26 | 6.63 | 9.60 | 13.53 | 18.22 | 22.27 |
AGE: Patient Age years
| n | missing | distinct | Info | Mean | Gmd | .05 | .10 | .25 | .50 | .75 | .90 | .95 |
|---|---|---|---|---|---|---|---|---|---|---|---|---|
| 14691 | 0 | 85 | 1 | 56.17 | 20.78 | 24 | 29 | 43 | 58 | 70 | 79 | 84 |
SEX: Patient sex 1=male, 2=female
| n | missing | distinct | Info | Mean | Gmd |
|---|---|---|---|---|---|
| 14691 | 0 | 2 | 0.73 | 1.419 | 0.4869 |
 Value          1     2
 Frequency   8536  6155
 Proportion 0.581 0.419
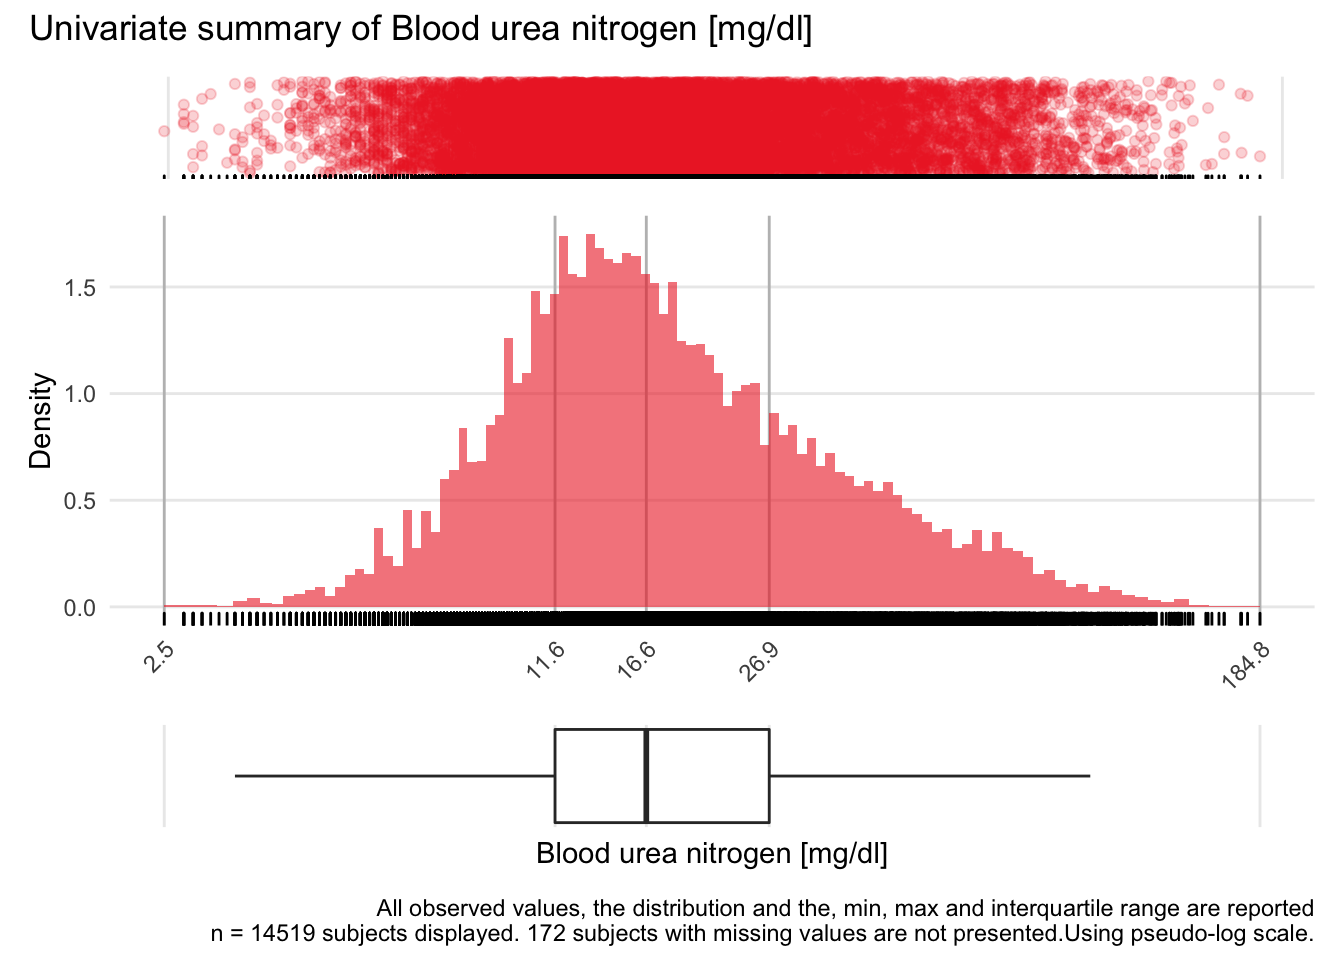
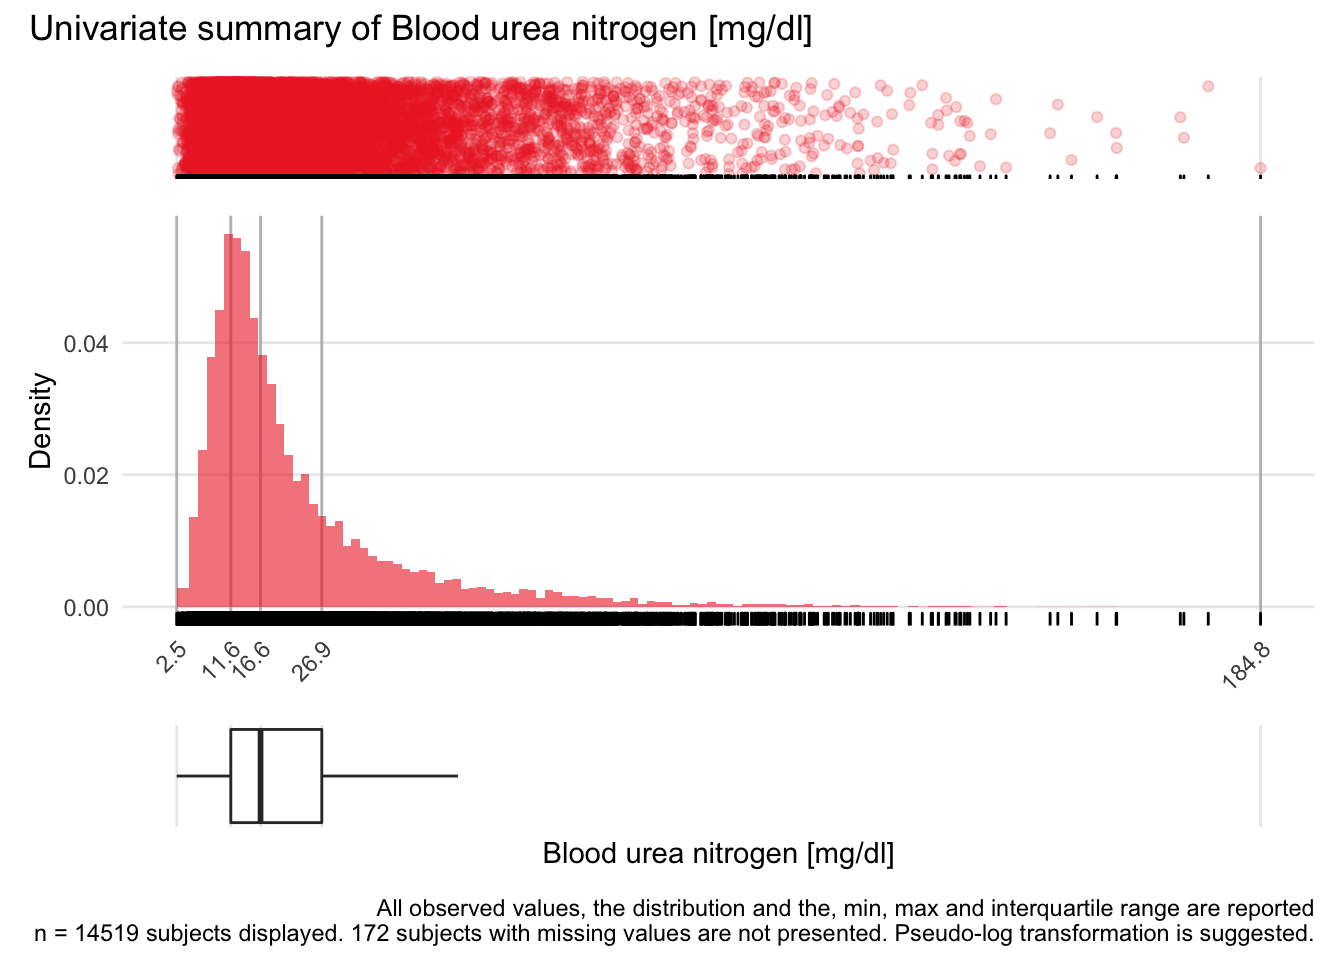
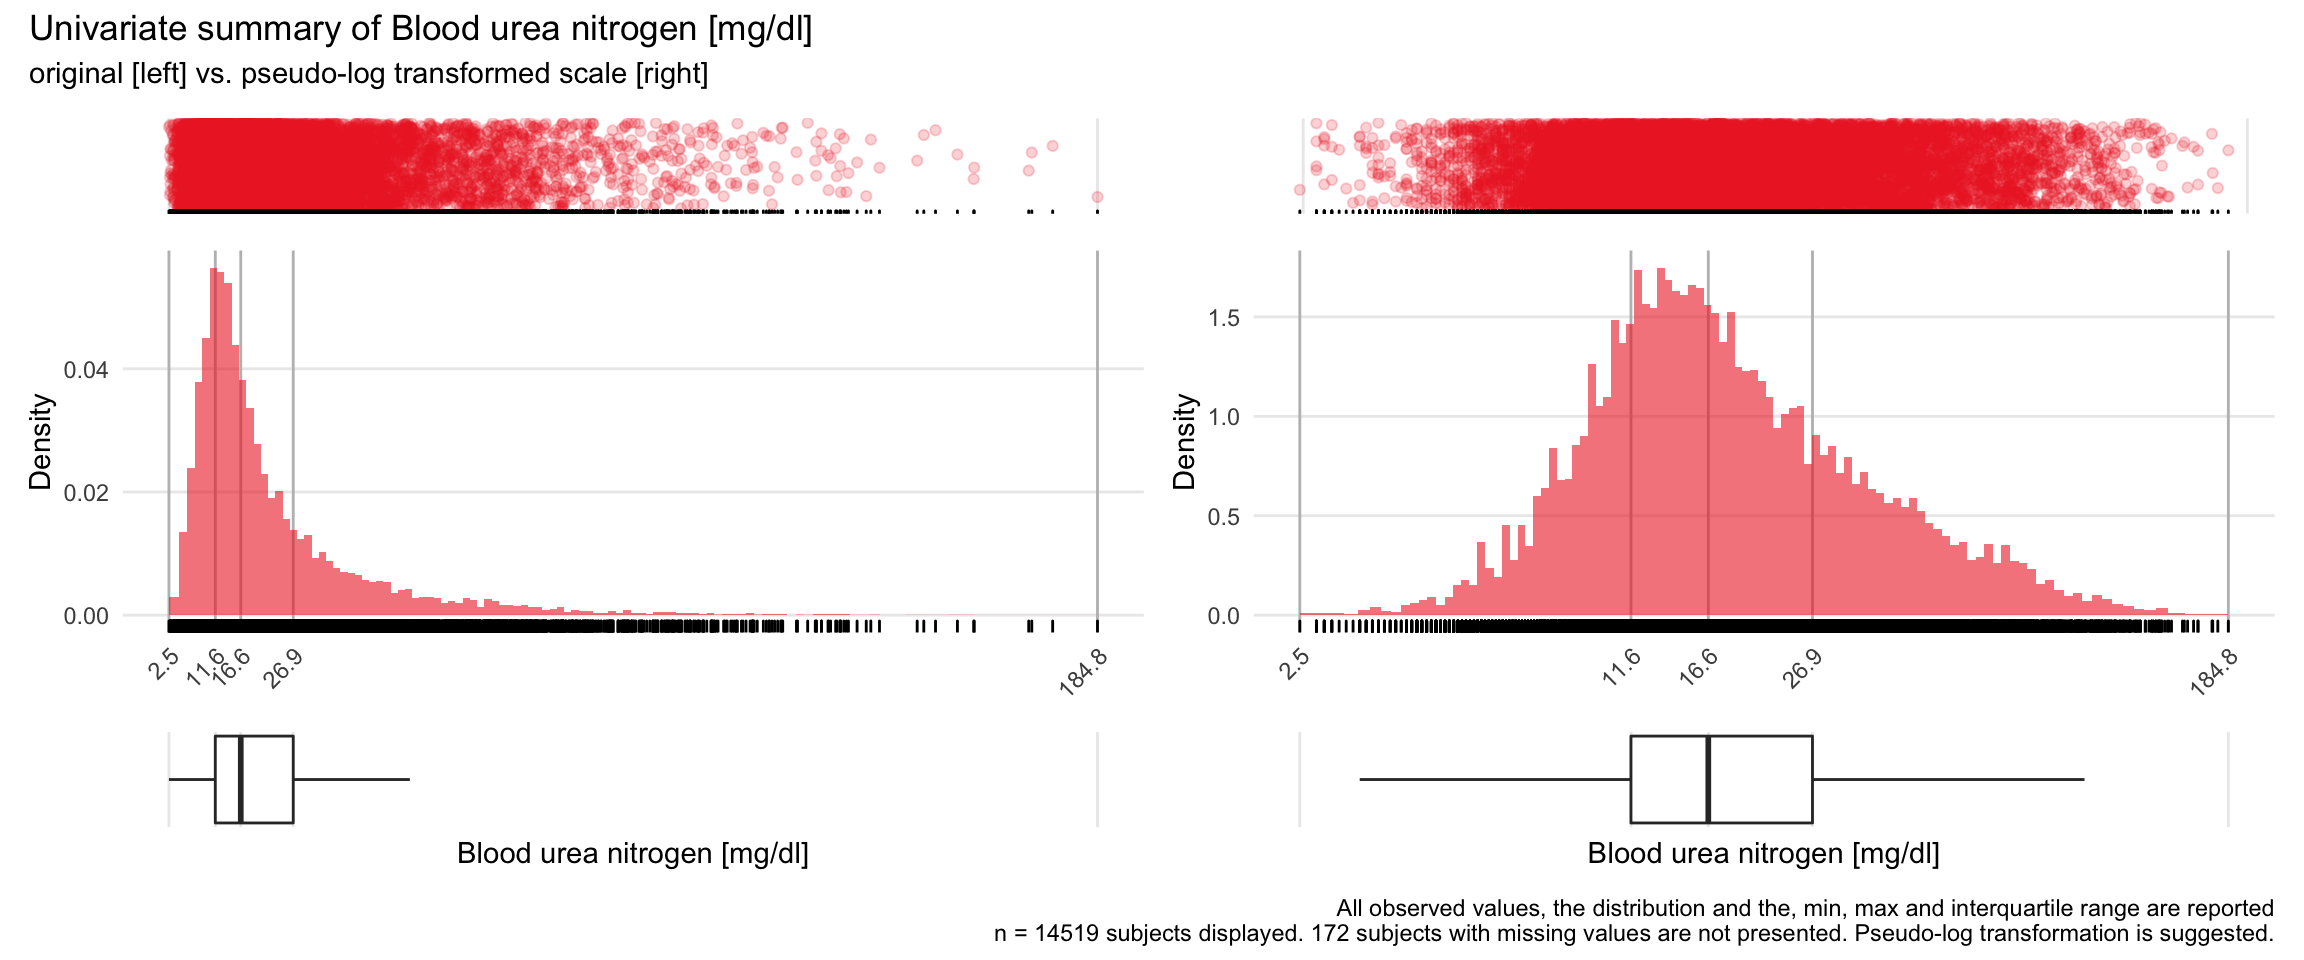
BUN: Blood urea nitrogen mg/dl

| n | missing | distinct | Info | Mean | Gmd | .05 | .10 | .25 | .50 | .75 | .90 | .95 |
|---|---|---|---|---|---|---|---|---|---|---|---|---|
| 14519 | 172 | 947 | 1 | 22.66 | 16.92 | 7.1 | 8.6 | 11.6 | 16.6 | 26.9 | 44.8 | 60.8 |
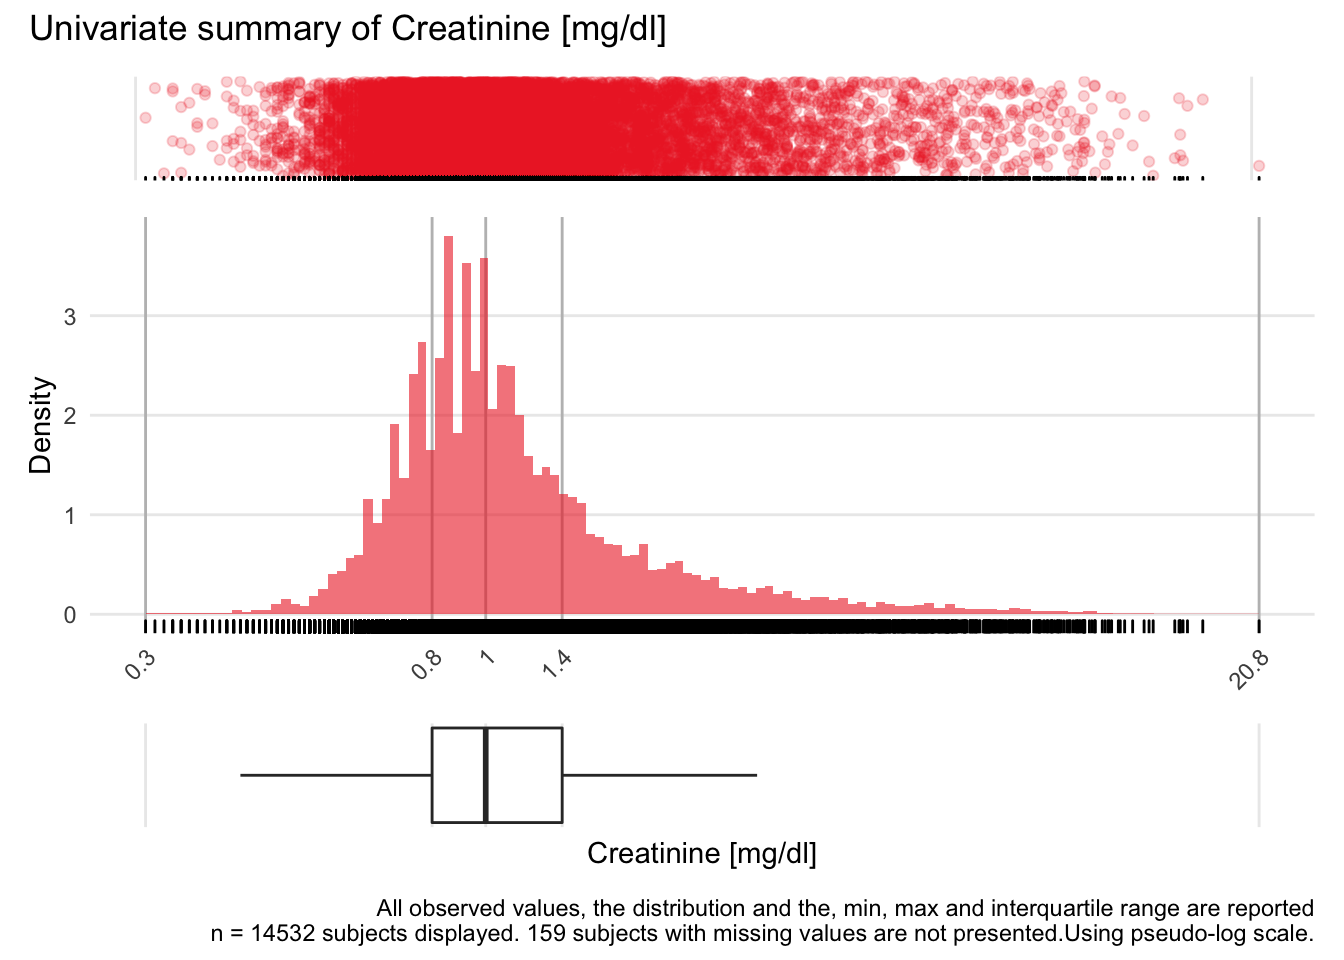
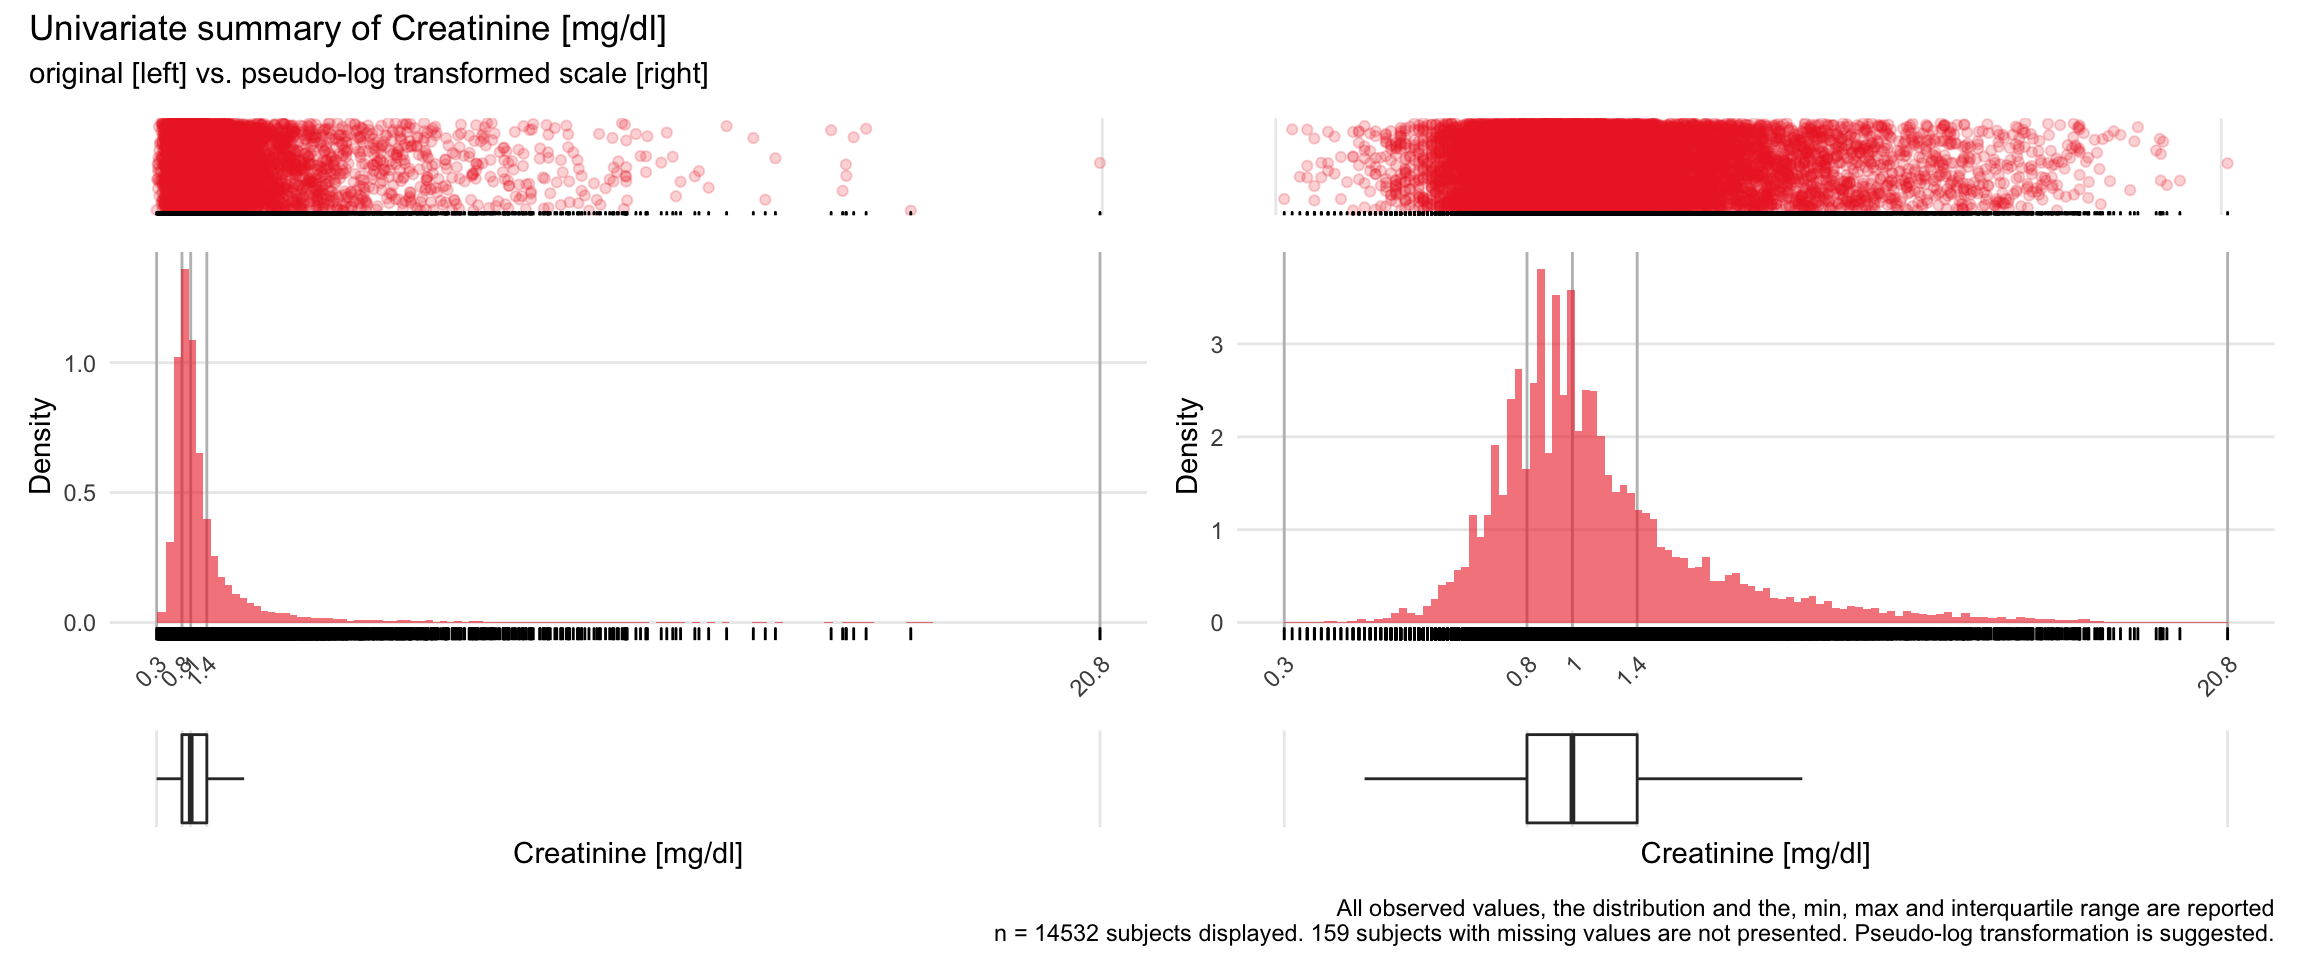
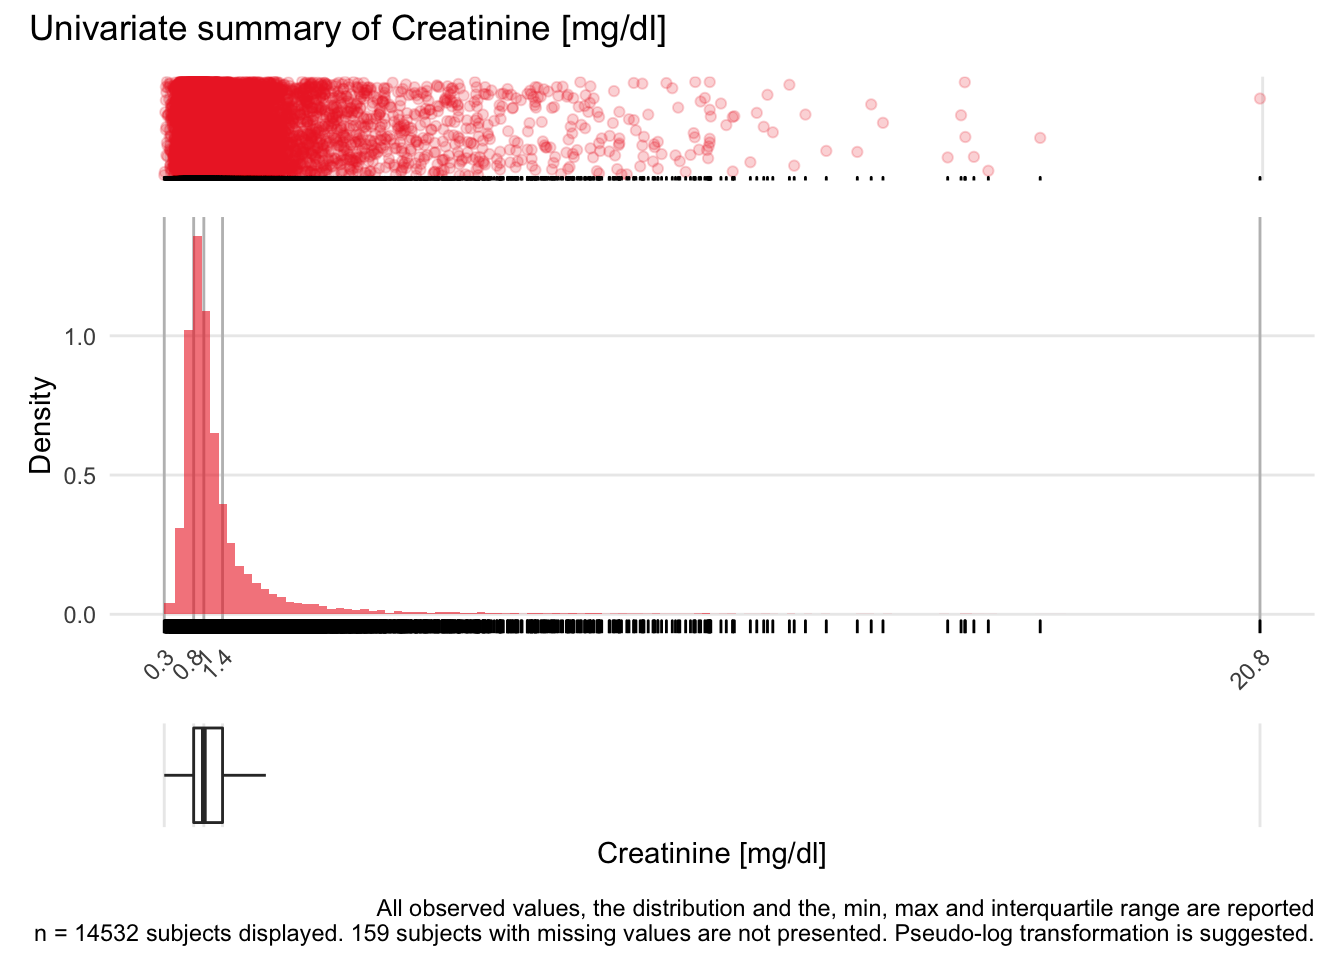
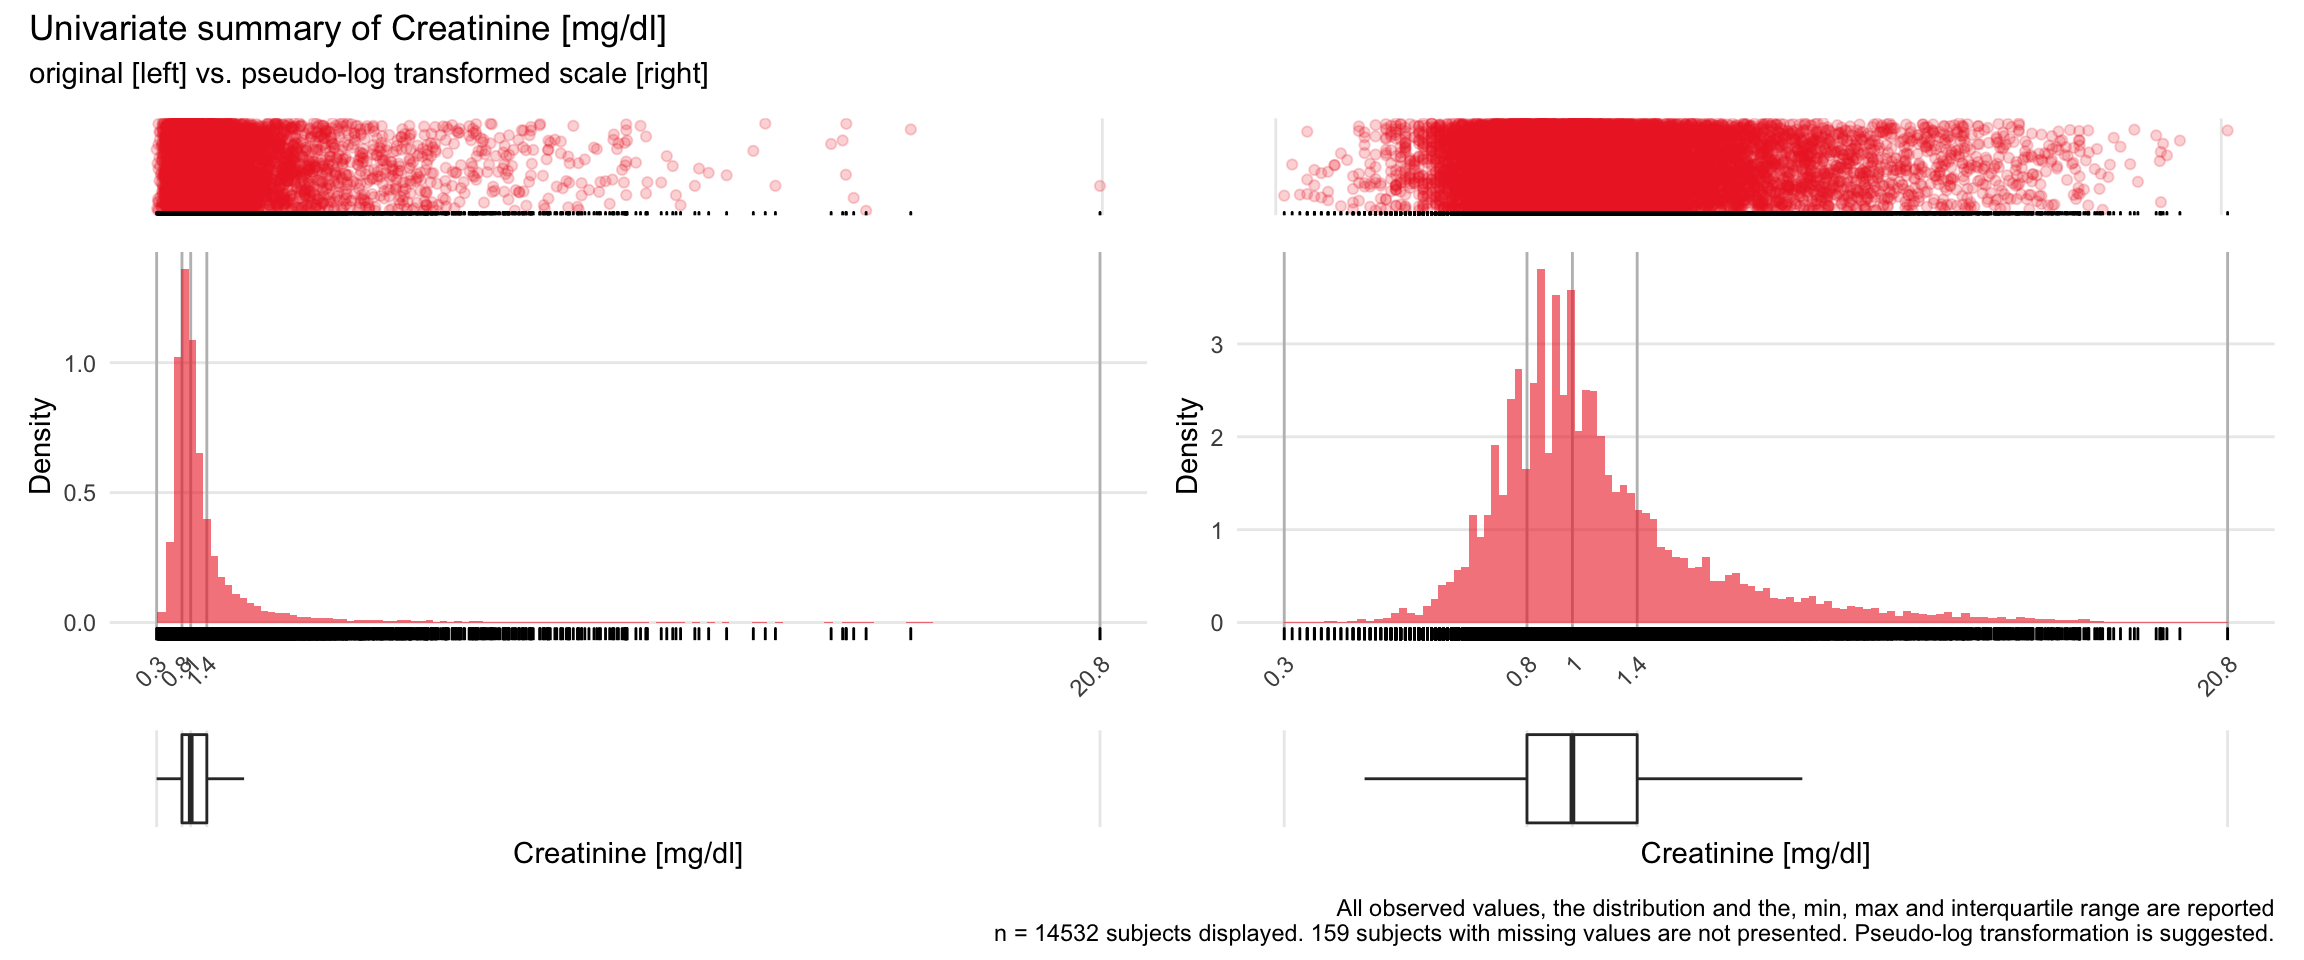
CREA: Creatinine mg/dl

| n | missing | distinct | Info | Mean | Gmd | .05 | .10 | .25 | .50 | .75 | .90 | .95 |
|---|---|---|---|---|---|---|---|---|---|---|---|---|
| 14532 | 159 | 674 | 1 | 1.329 | 0.8518 | 0.620 | 0.690 | 0.810 | 1.000 | 1.350 | 2.160 | 3.144 |
NEU: Neutrophiles G/L

| n | missing | distinct | Info | Mean | Gmd | .05 | .10 | .25 | .50 | .75 | .90 | .95 |
|---|---|---|---|---|---|---|---|---|---|---|---|---|
| 13963 | 728 | 374 | 1 | 8.367 | 5.776 | 1.60 | 2.70 | 4.60 | 7.30 | 10.80 | 15.08 | 18.40 |
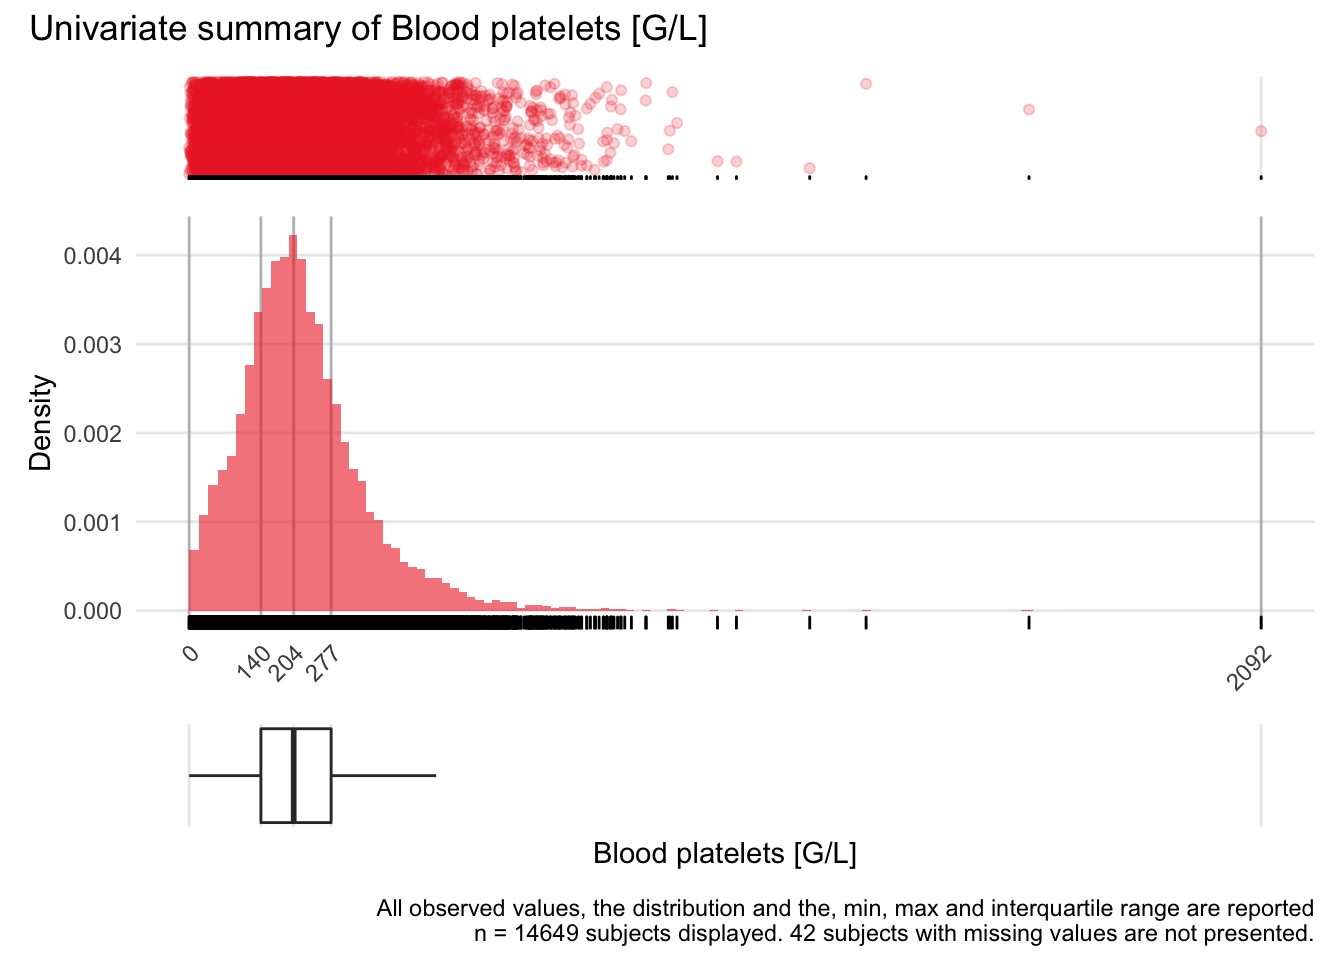
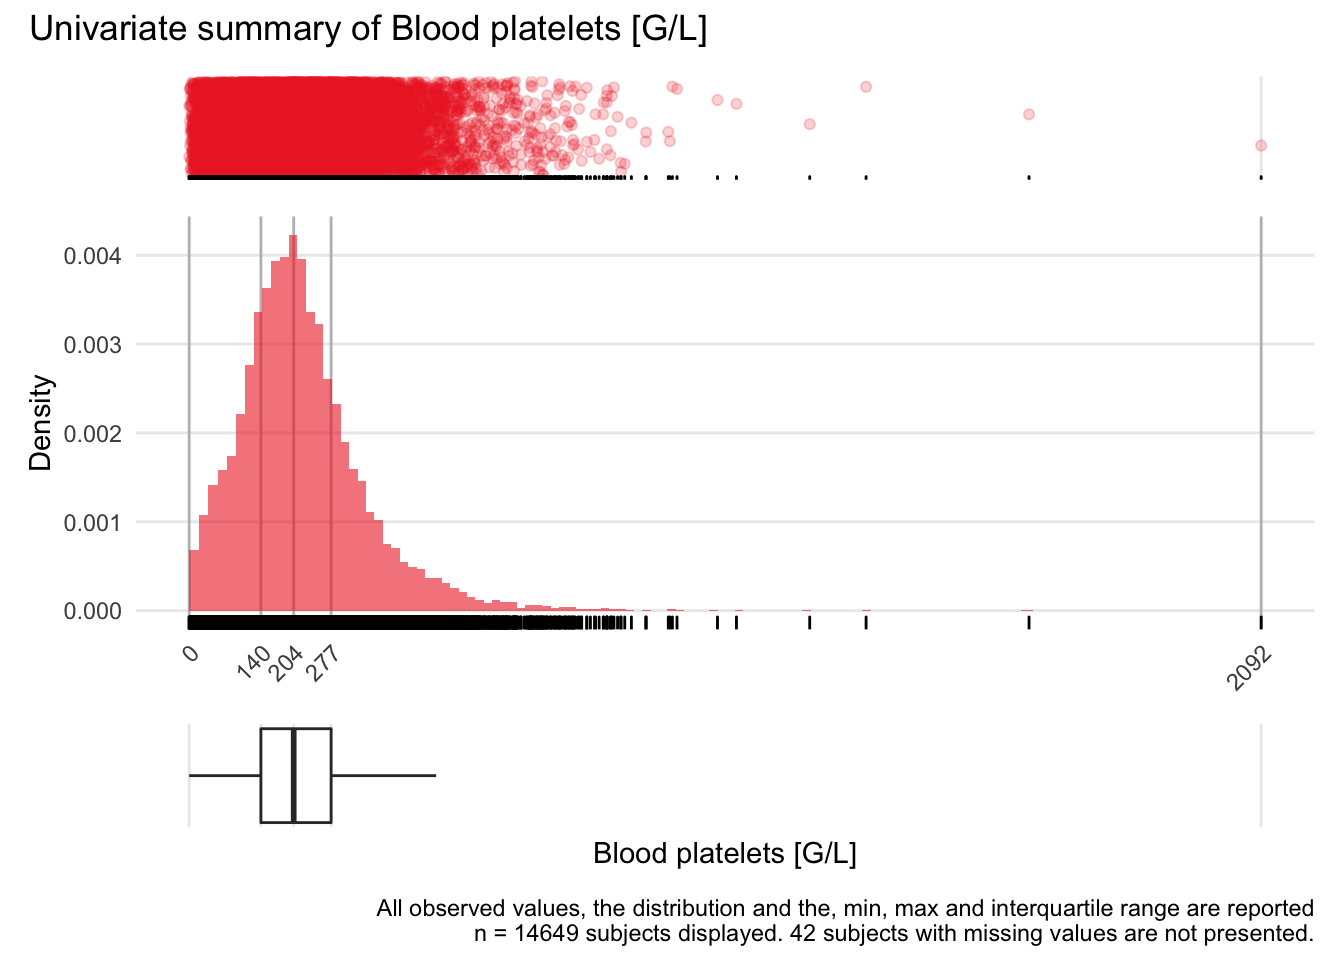
PLT: Blood platelets G/L

| n | missing | distinct | Info | Mean | Gmd | .05 | .10 | .25 | .50 | .75 | .90 | .95 |
|---|---|---|---|---|---|---|---|---|---|---|---|---|
| 14649 | 42 | 718 | 1 | 220 | 130.1 | 50 | 81 | 140 | 204 | 277 | 369 | 445 |
8.1.3 Further variables related to leukocyte types and leukocyte ratios
11 Variables 14691 Observations
WBC: White blood count G/L
| n | missing | distinct | Info | Mean | Gmd | .05 | .10 | .25 | .50 | .75 | .90 | .95 |
|---|---|---|---|---|---|---|---|---|---|---|---|---|
| 14229 | 462 | 2710 | 1 | 11.23 | 7.602 | 2.66 | 4.26 | 6.63 | 9.60 | 13.53 | 18.22 | 22.27 |
NEU: Neutrophiles G/L
| n | missing | distinct | Info | Mean | Gmd | .05 | .10 | .25 | .50 | .75 | .90 | .95 |
|---|---|---|---|---|---|---|---|---|---|---|---|---|
| 13963 | 728 | 374 | 1 | 8.367 | 5.776 | 1.60 | 2.70 | 4.60 | 7.30 | 10.80 | 15.08 | 18.40 |
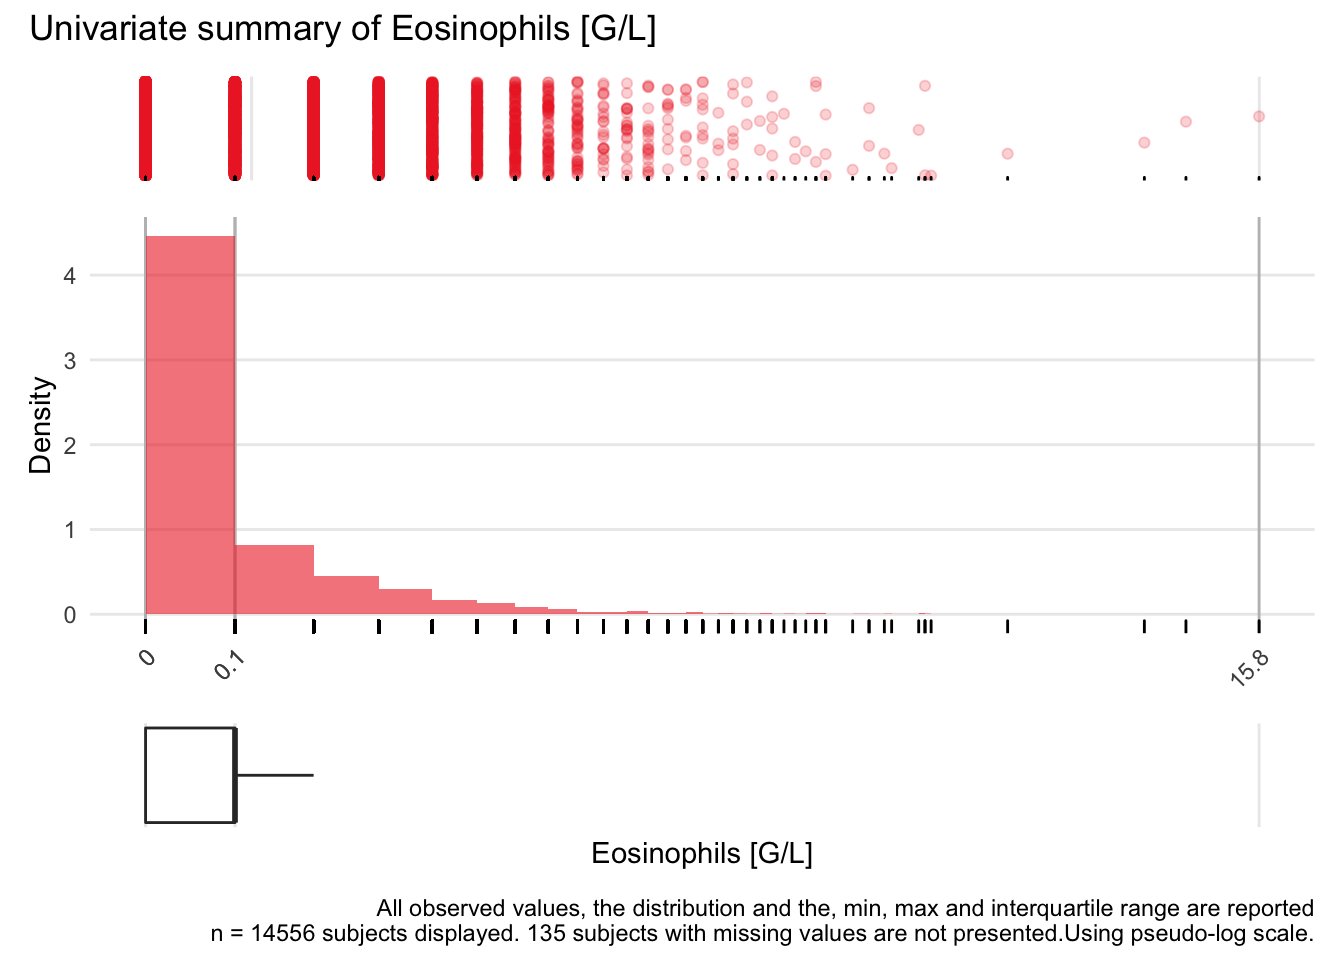
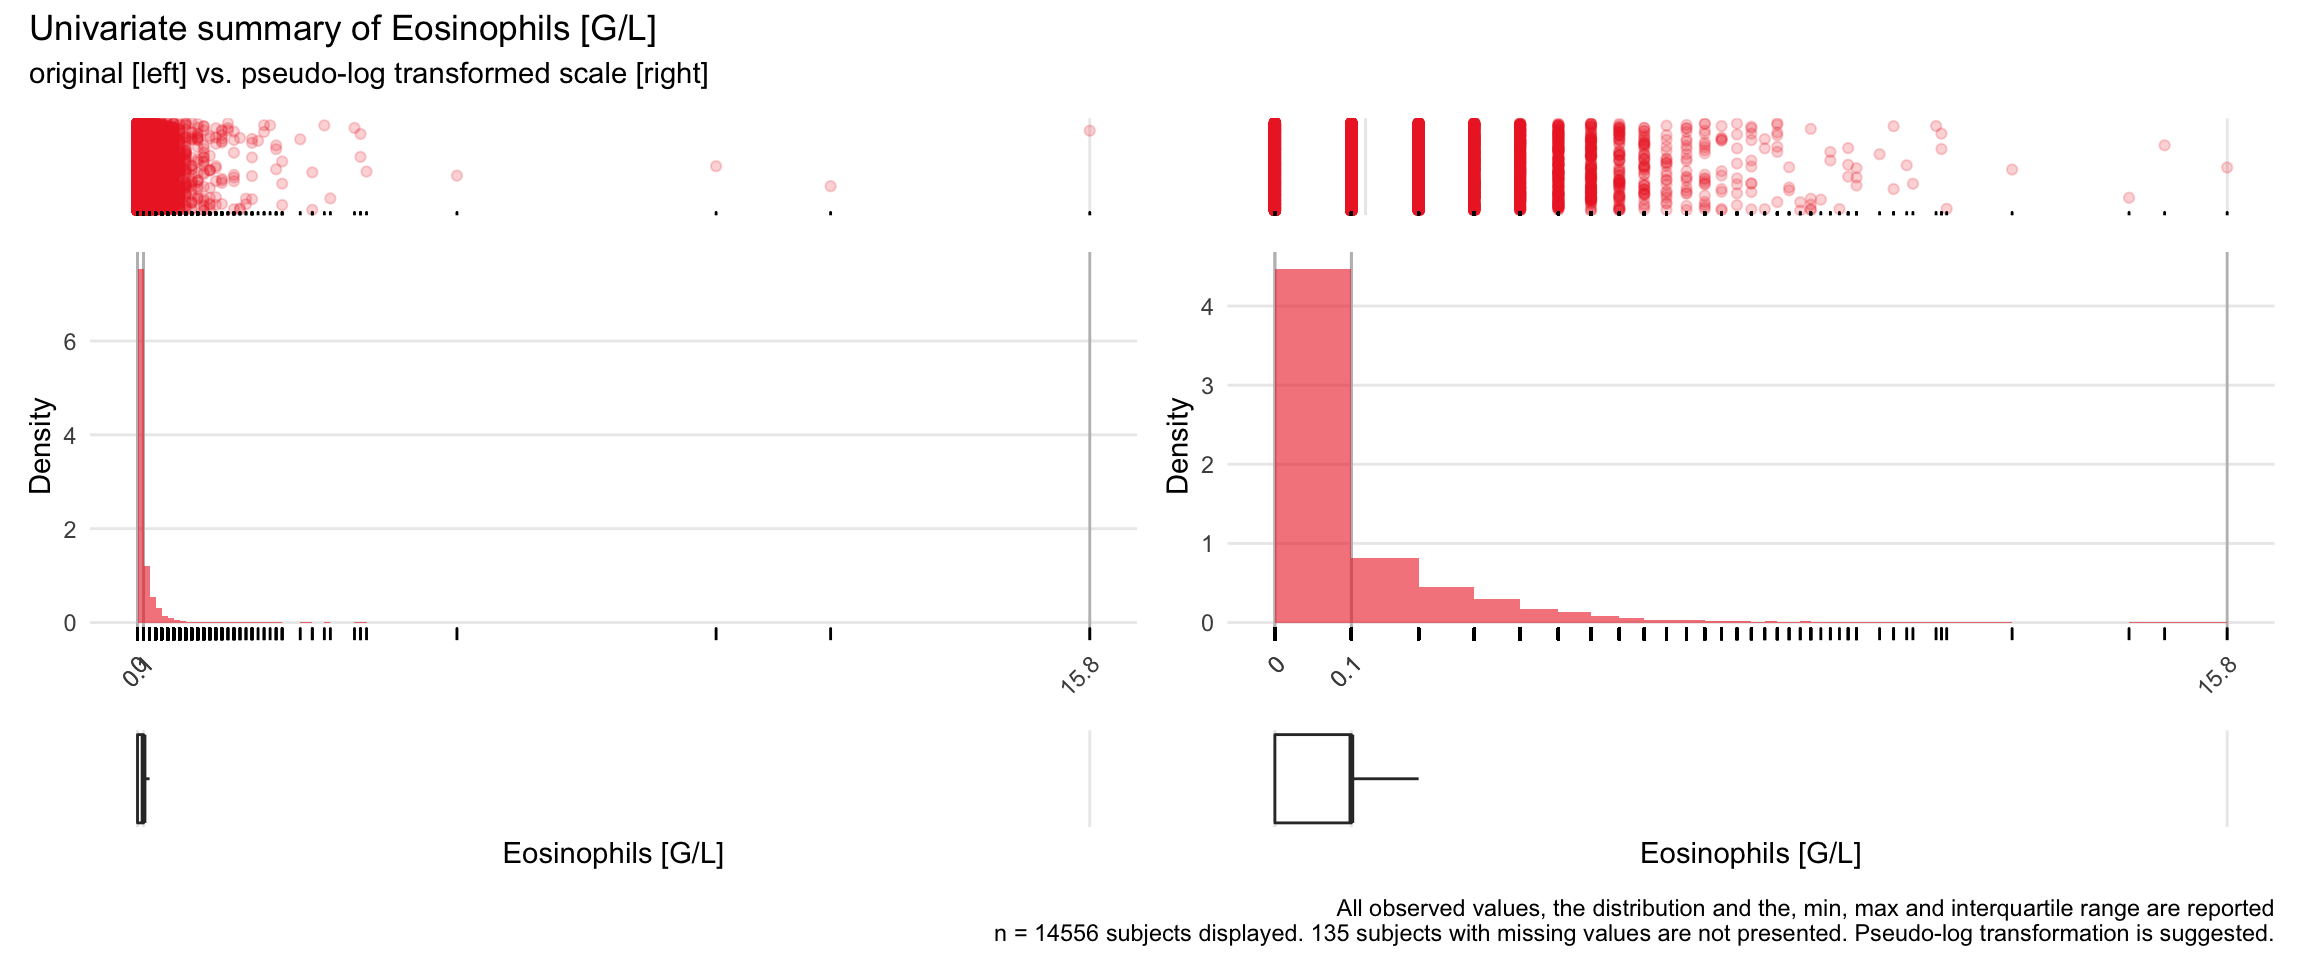
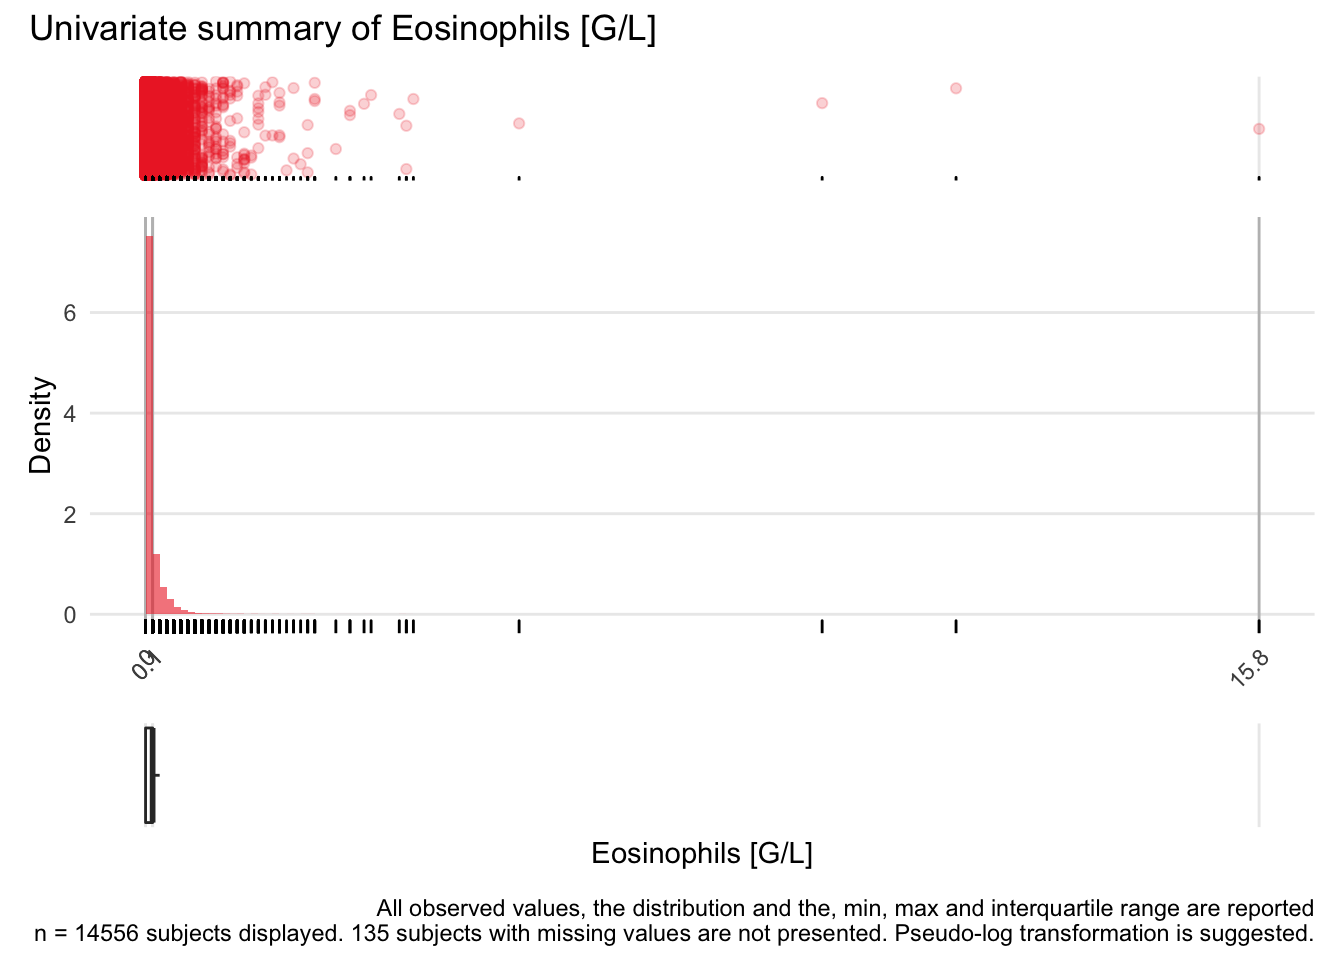
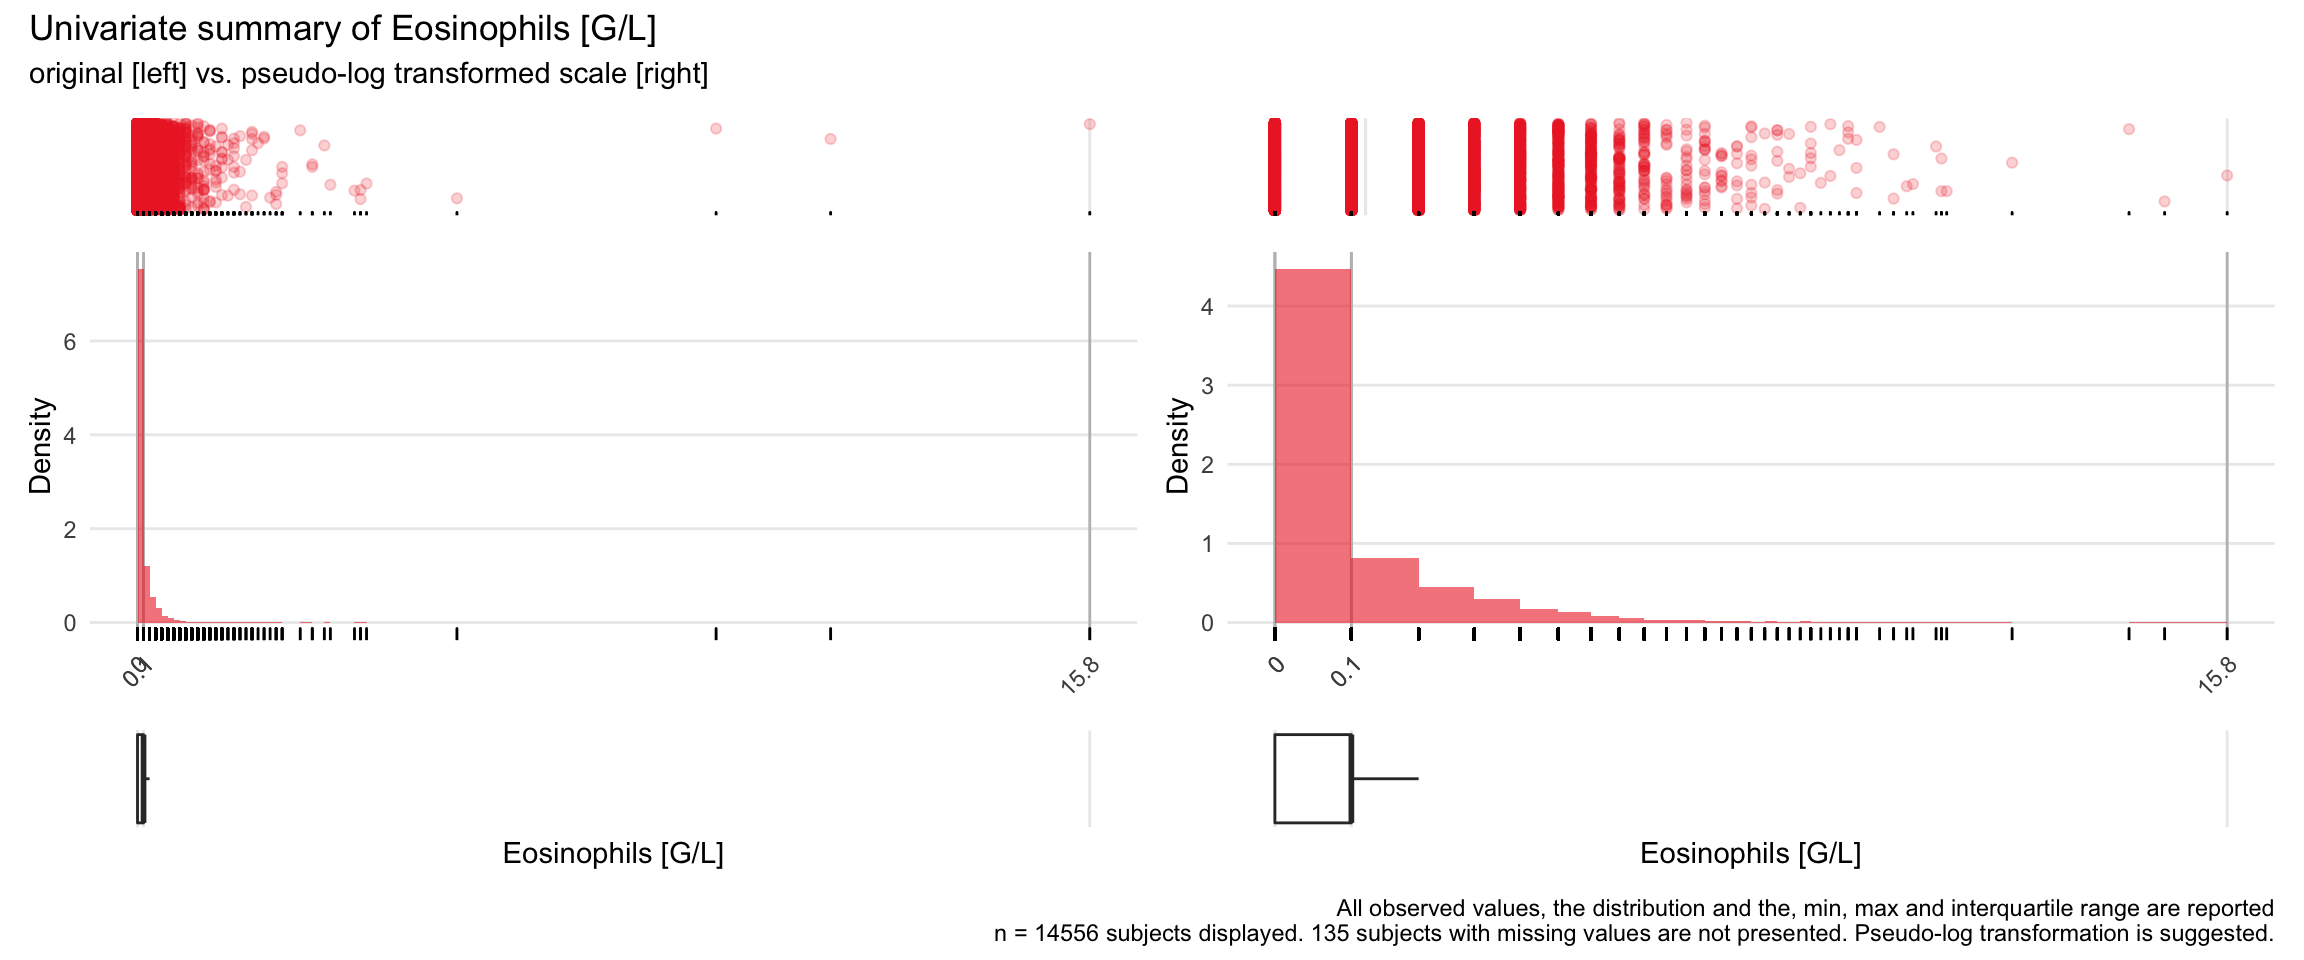
EOS: Eosinophils G/L

| n | missing | distinct | Info | Mean | Gmd | .05 | .10 | .25 | .50 | .75 | .90 | .95 |
|---|---|---|---|---|---|---|---|---|---|---|---|---|
| 14556 | 135 | 36 | 0.867 | 0.1148 | 0.1585 | 0.0 | 0.0 | 0.0 | 0.1 | 0.1 | 0.3 | 0.4 |
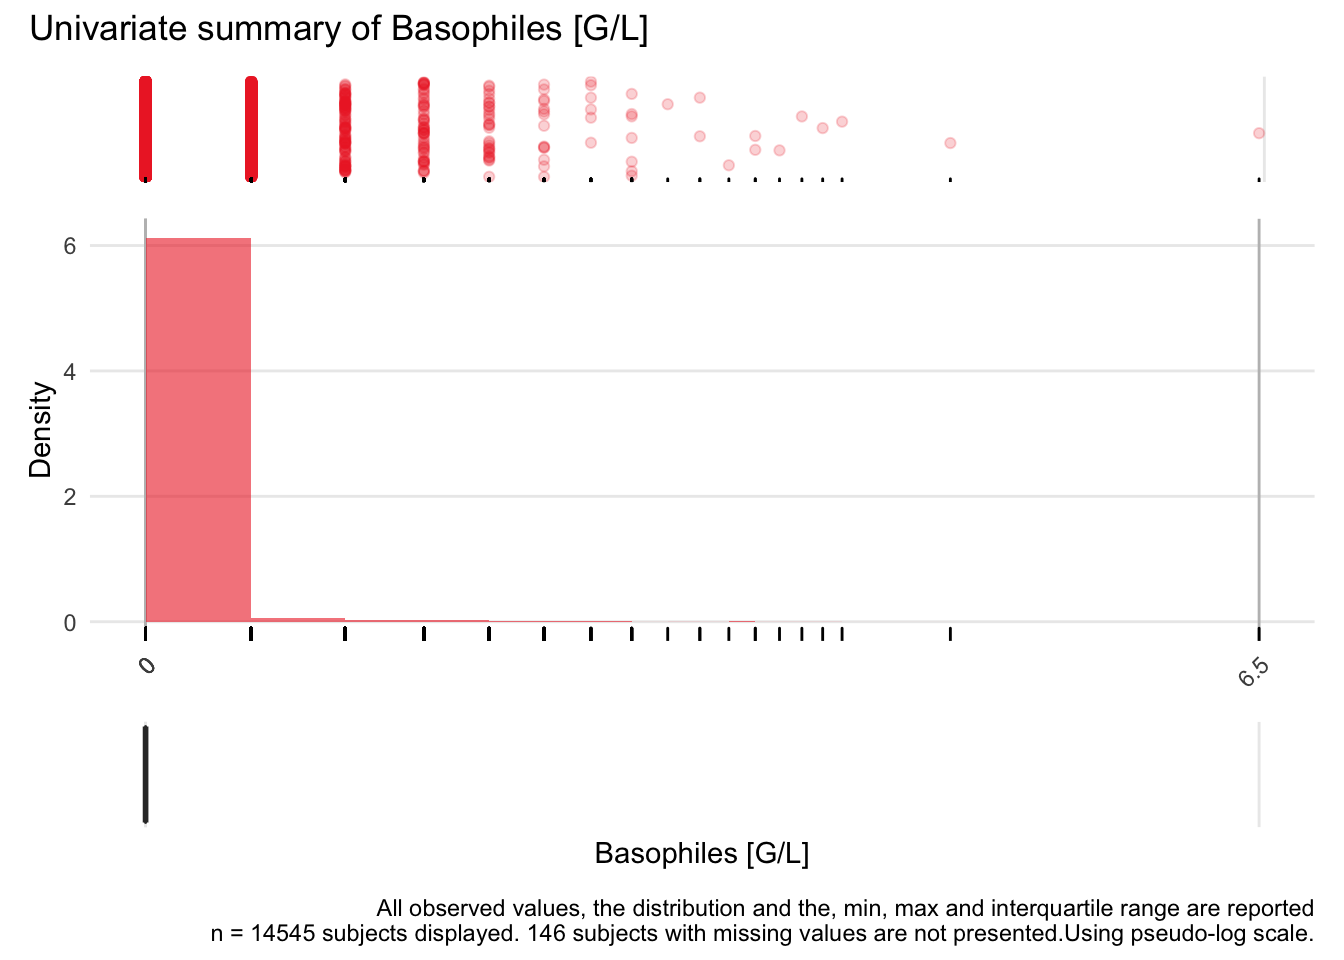
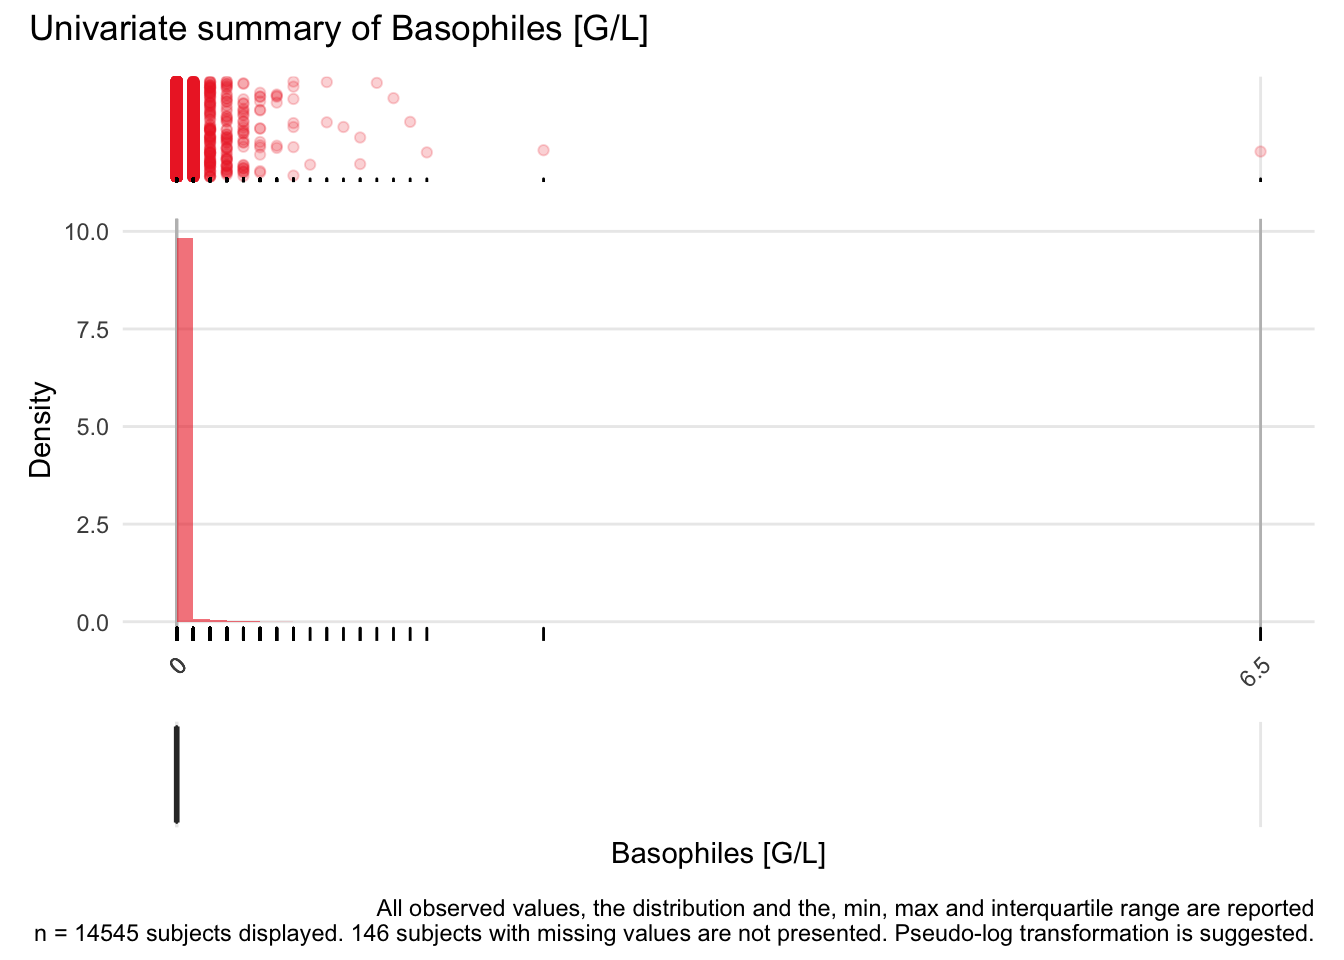
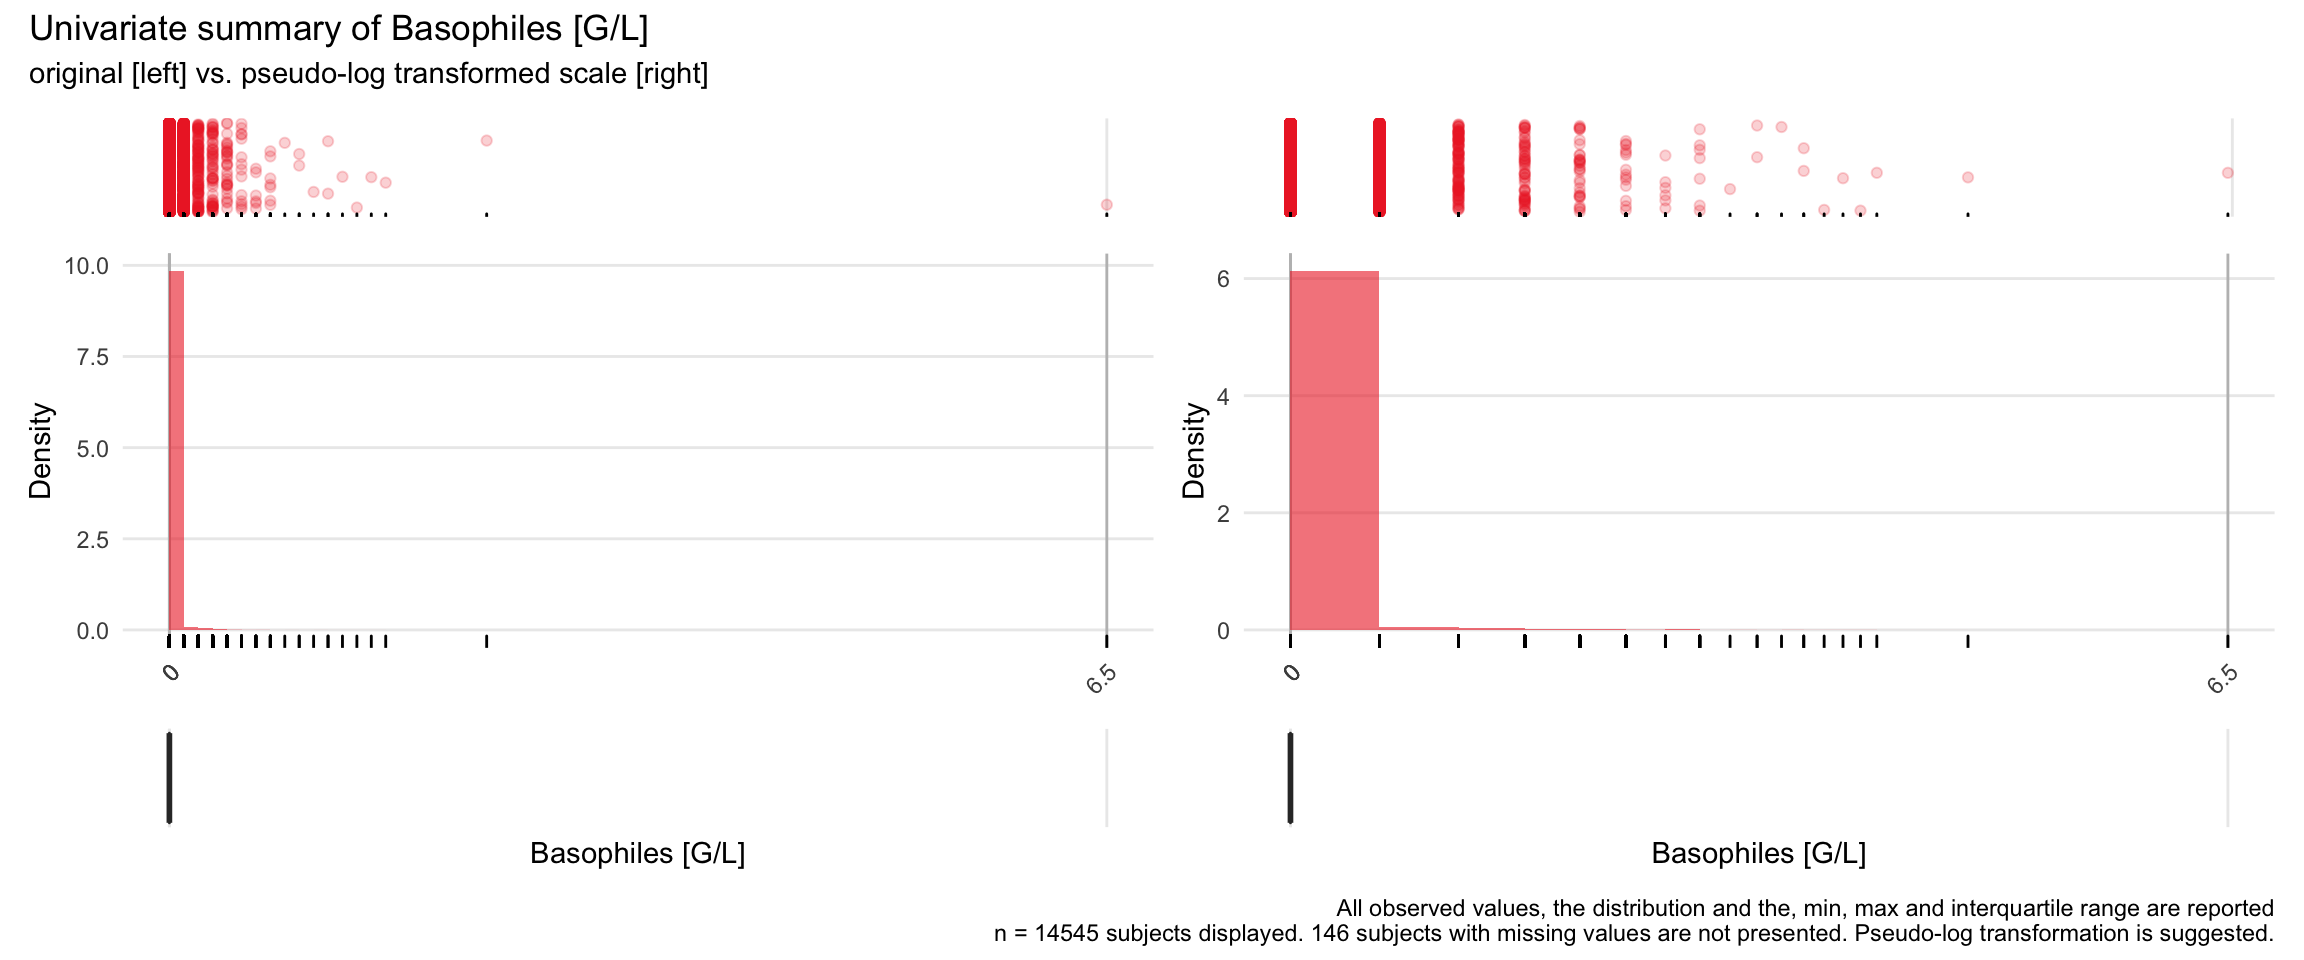
BASO: Basophiles G/L

| n | missing | distinct | Info | Mean | Gmd | .05 | .10 | .25 | .50 | .75 | .90 | .95 |
|---|---|---|---|---|---|---|---|---|---|---|---|---|
| 14545 | 146 | 18 | 0.337 | 0.01725 | 0.03111 | 0.0 | 0.0 | 0.0 | 0.0 | 0.0 | 0.1 | 0.1 |
 Value        0.0   0.1   0.2   0.3   0.4   0.5   0.6   0.7   0.8   0.9   1.0   1.1
 Frequency  12671  1636   109    59    31    14     6     7     1     2     1     2
 Proportion 0.871 0.112 0.007 0.004 0.002 0.001 0.000 0.000 0.000 0.000 0.000 0.000

 Value        1.2   1.3   1.4   1.5   2.2   6.5
 Frequency      1     1     1     1     1     1
 Proportion 0.000 0.000 0.000 0.000 0.000 0.000
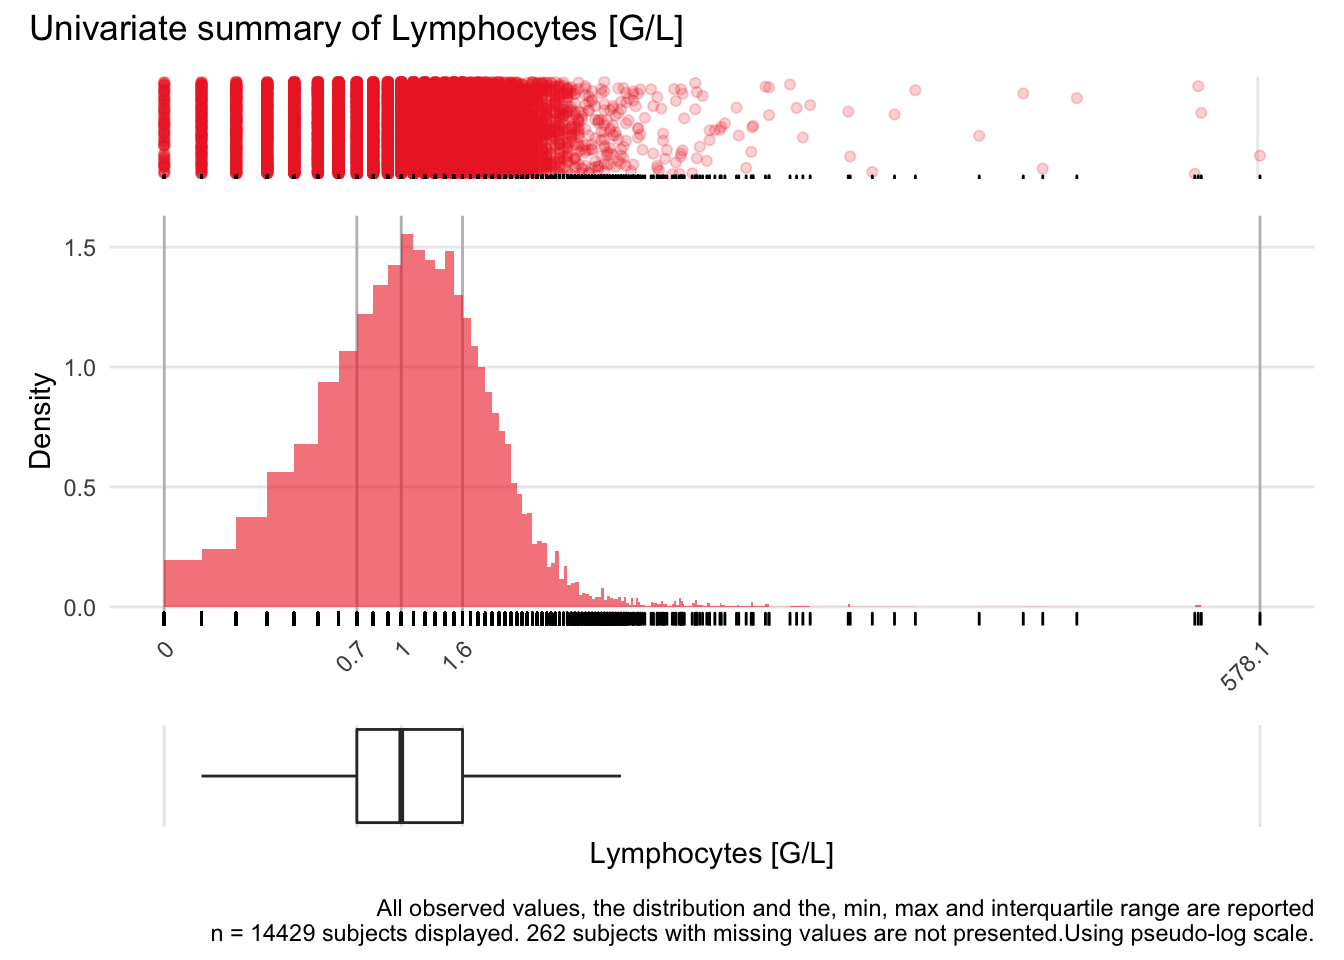
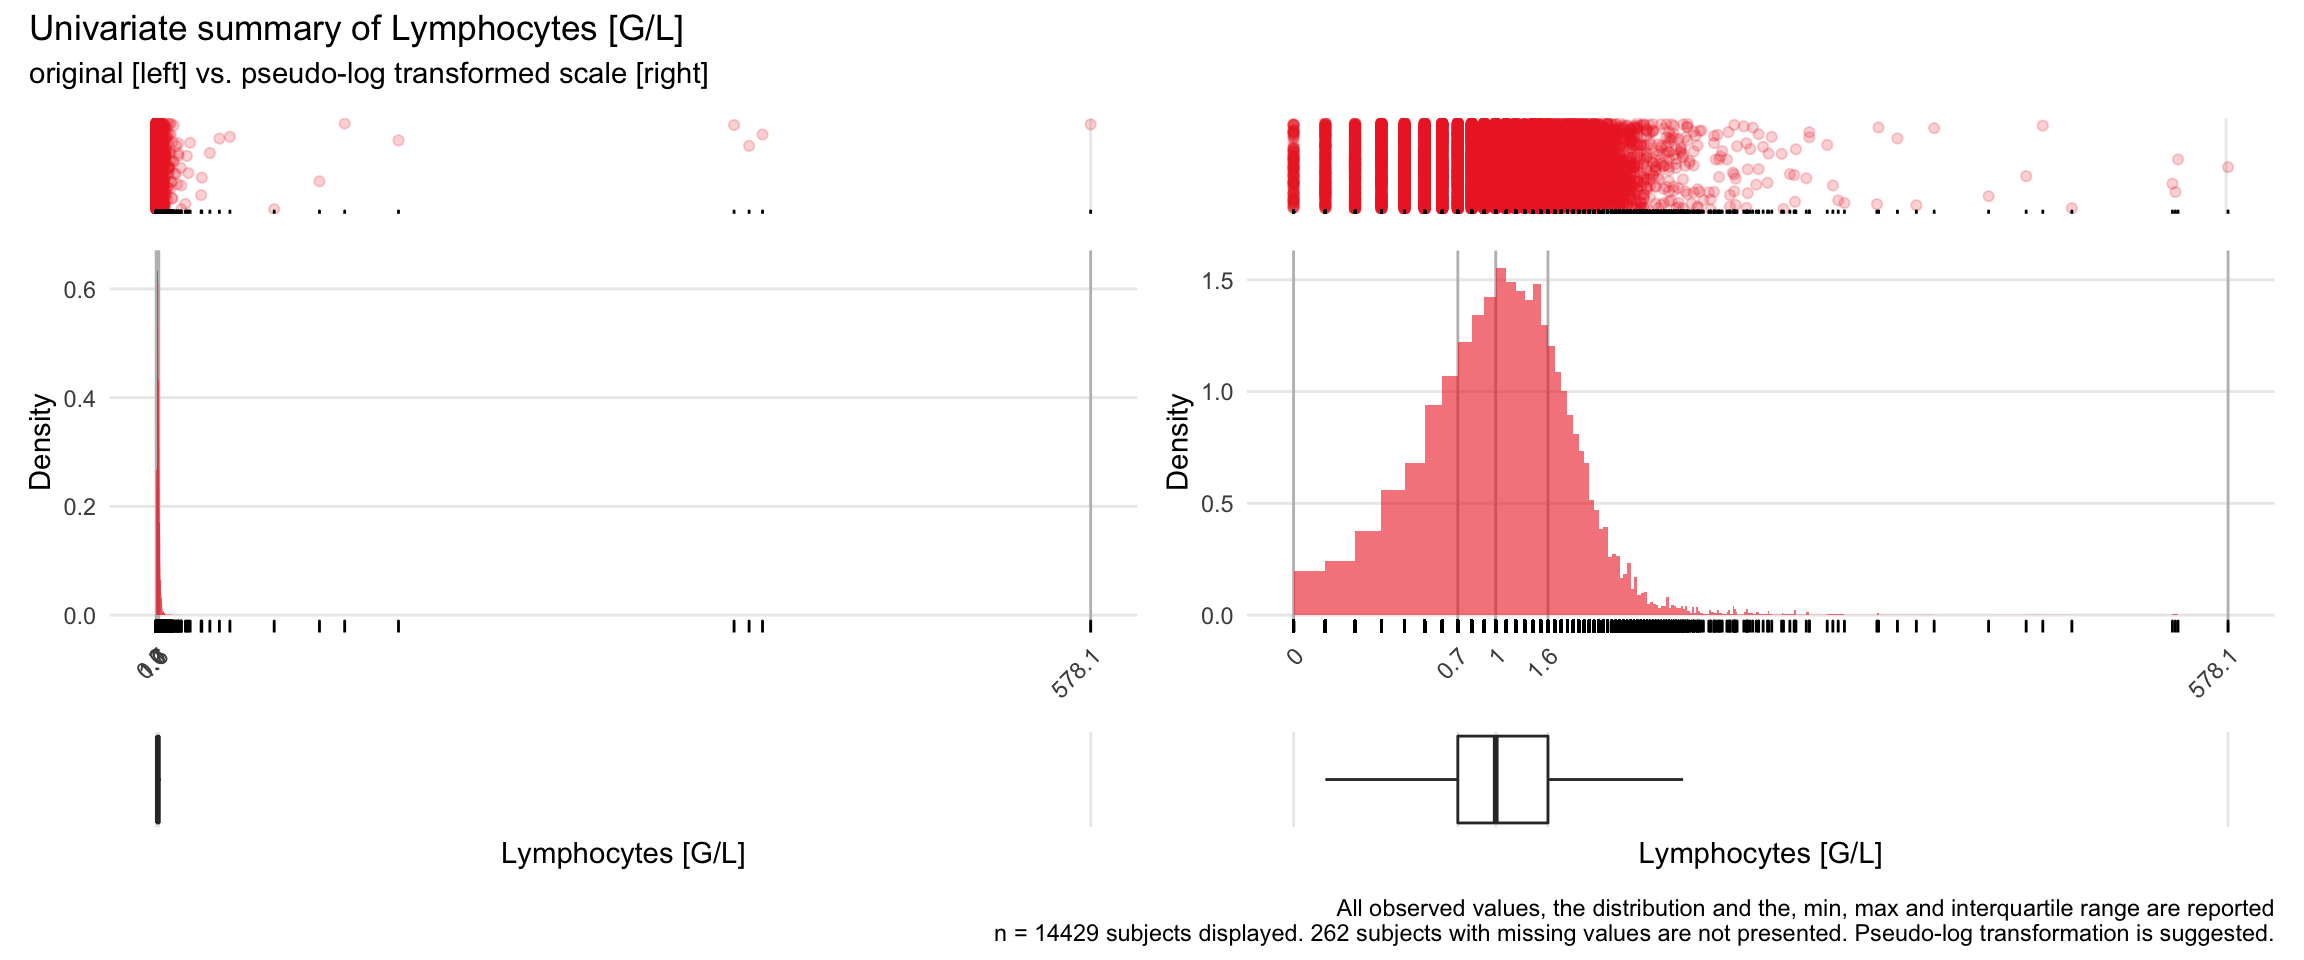
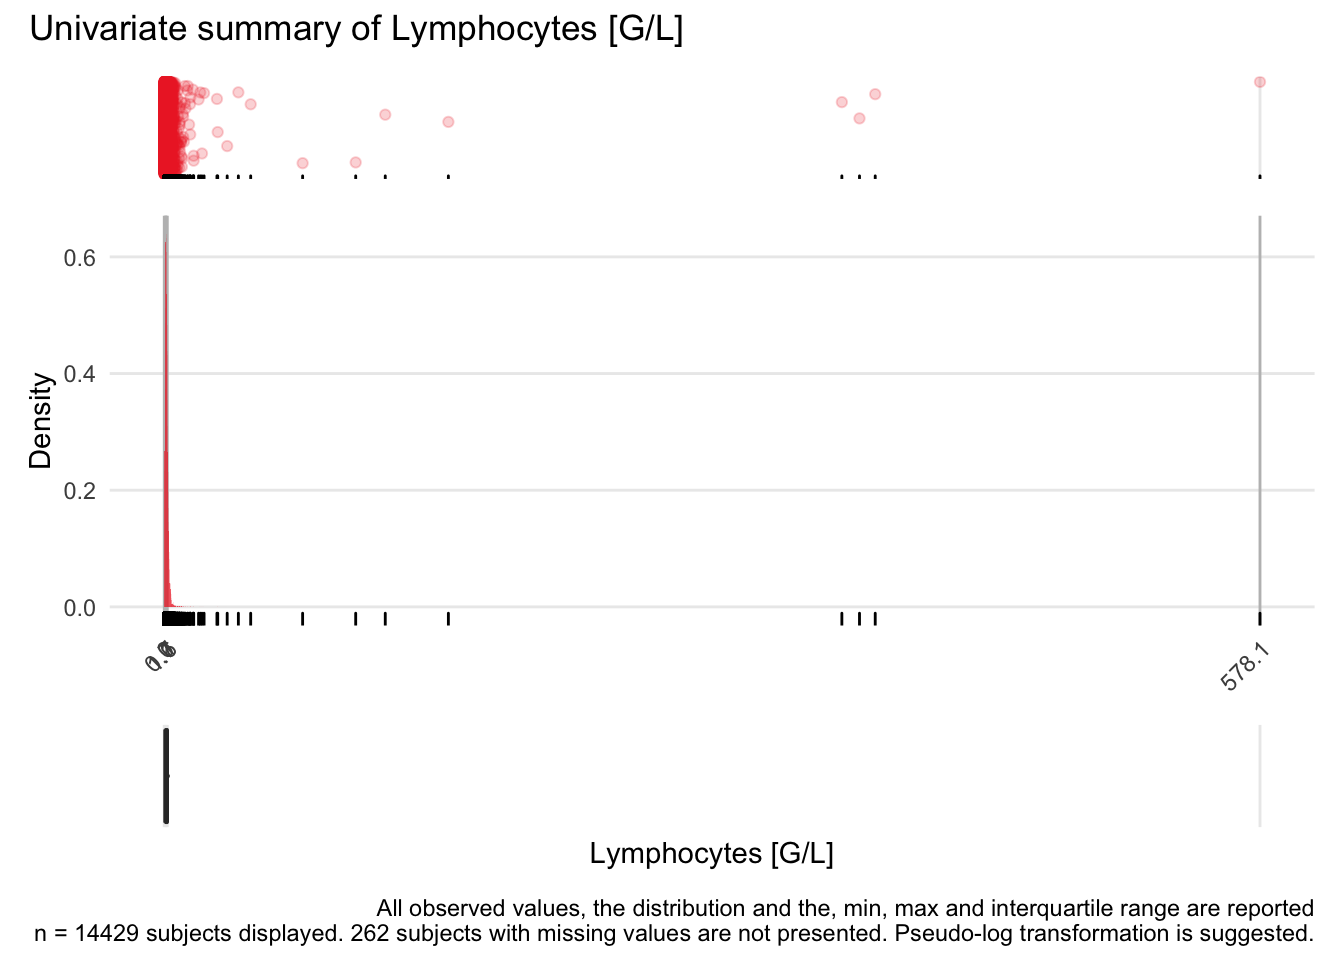
LYM: Lymphocytes G/L

| n | missing | distinct | Info | Mean | Gmd | .05 | .10 | .25 | .50 | .75 | .90 | .95 |
|---|---|---|---|---|---|---|---|---|---|---|---|---|
| 14429 | 262 | 114 | 0.998 | 1.366 | 1.162 | 0.2 | 0.4 | 0.7 | 1.0 | 1.6 | 2.1 | 2.6 |
 Value          0     5    10    15    20    30    35    40    45    75   100   115
 Frequency  13675   703    27     7     4     2     1     1     1     1     1     1
 Proportion 0.948 0.049 0.002 0.000 0.000 0.000 0.000 0.000 0.000 0.000 0.000 0.000

 Value        150   360   365   375   580
 Frequency      1     1     1     1     1
 Proportion 0.000 0.000 0.000 0.000 0.000
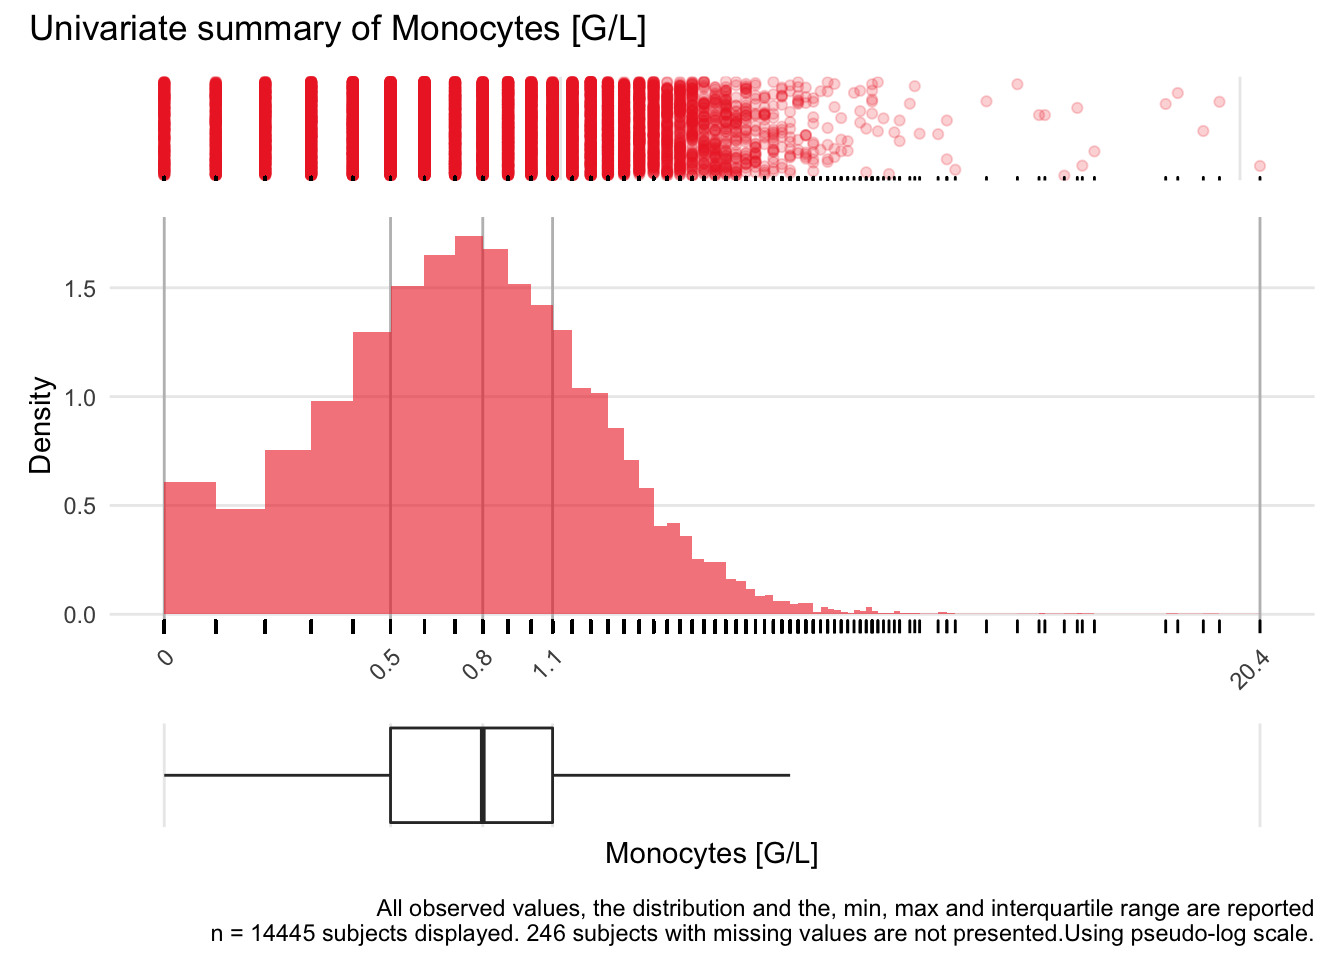
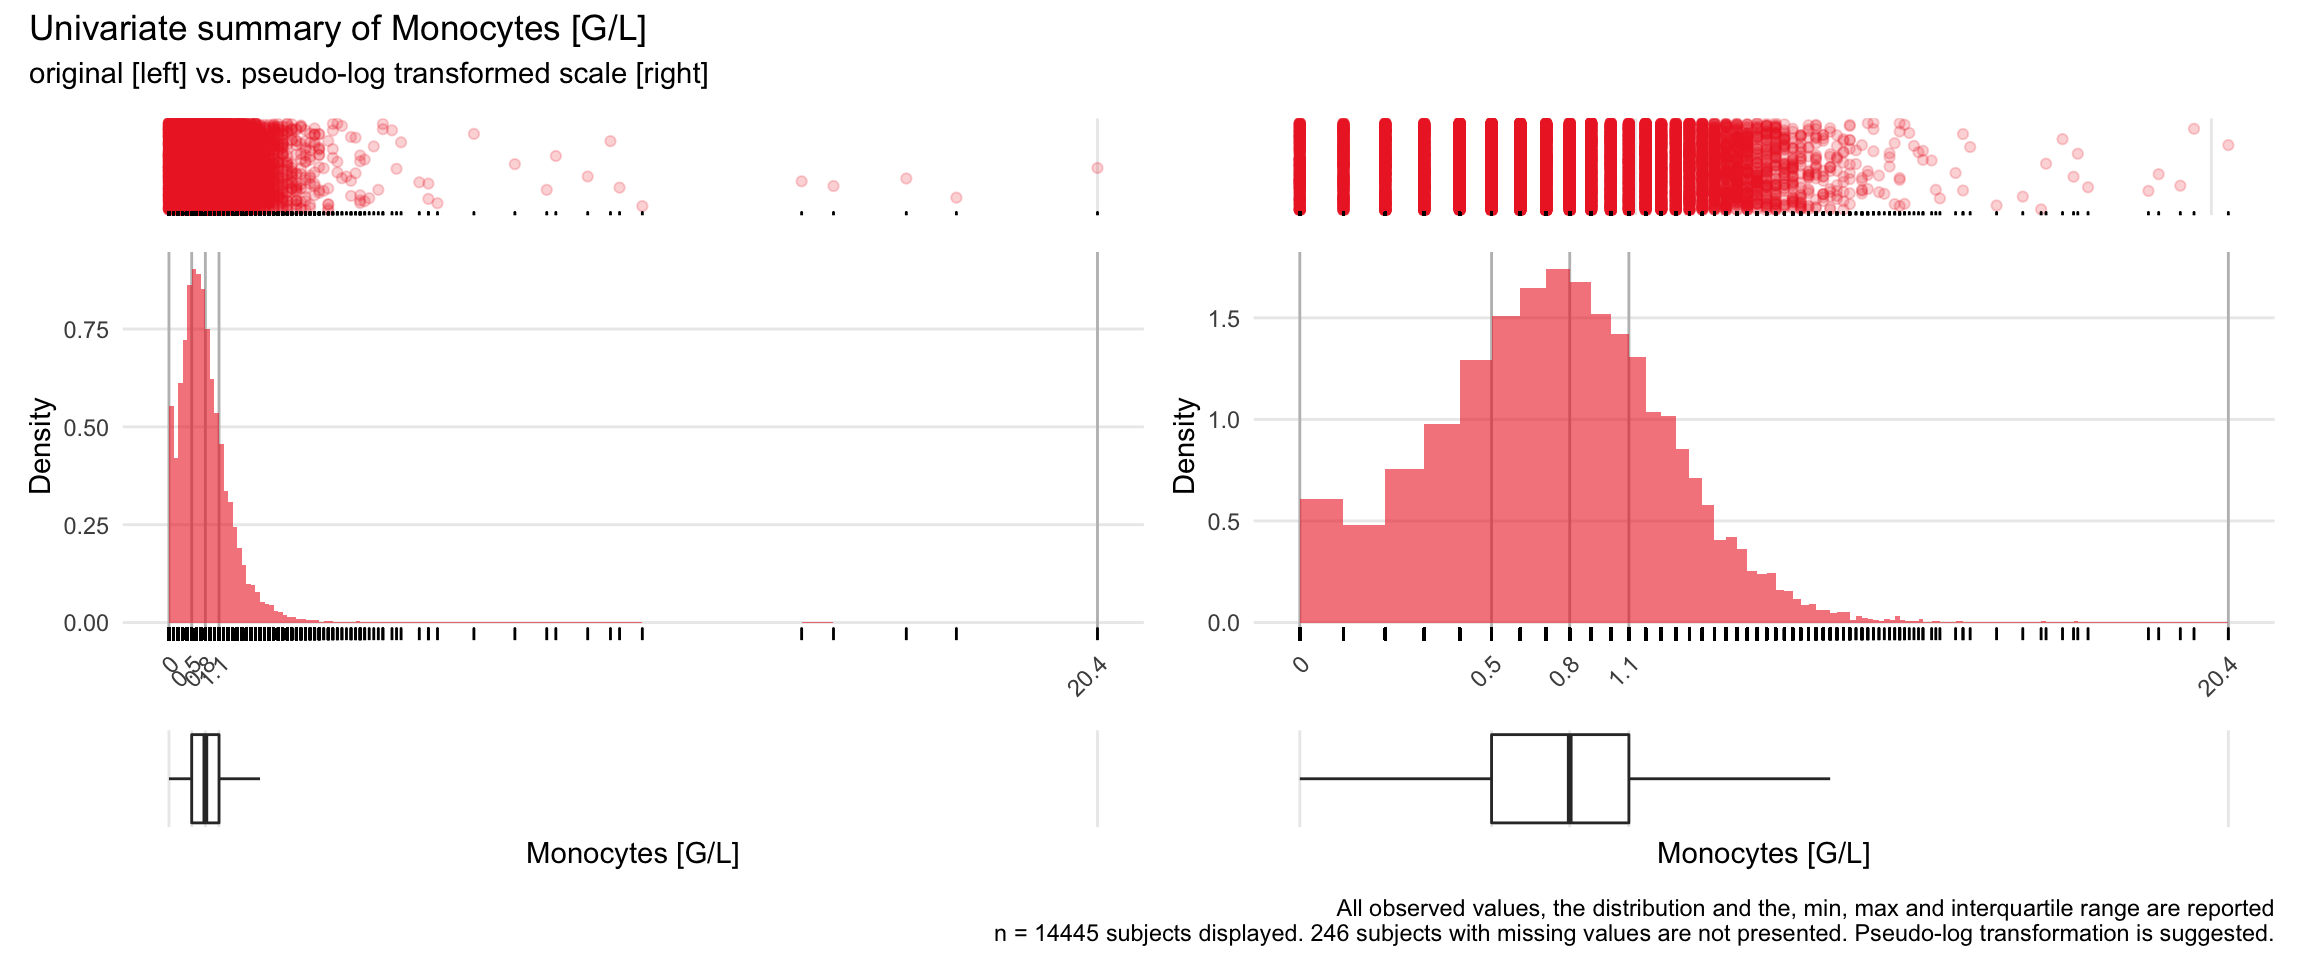
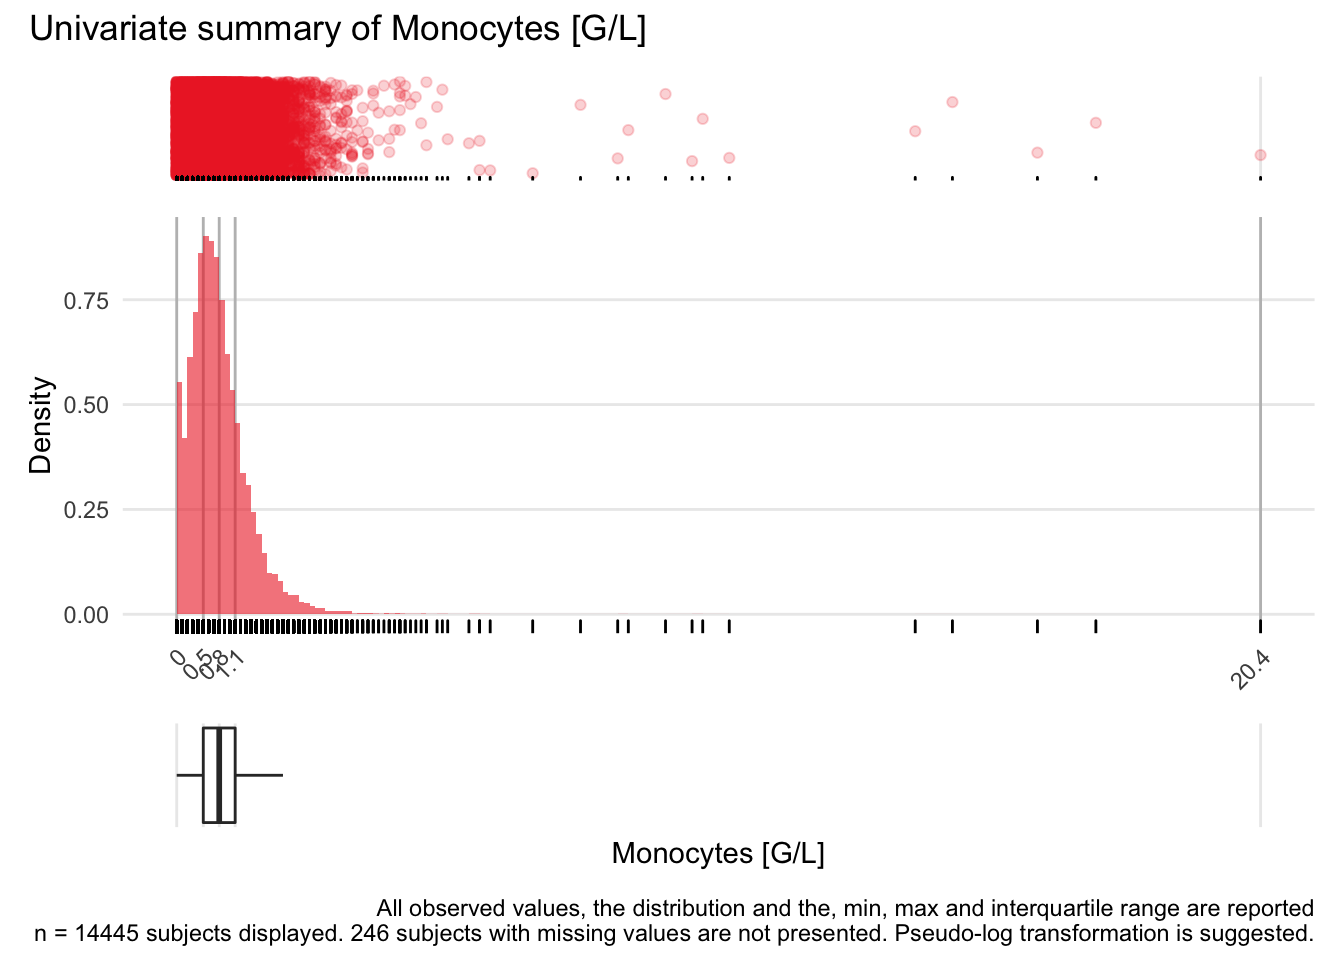
For the frequency table, variable is rounded to the nearest 5 MONO: Monocytes G/L

| n | missing | distinct | Info | Mean | Gmd | .05 | .10 | .25 | .50 | .75 | .90 | .95 |
|---|---|---|---|---|---|---|---|---|---|---|---|---|
| 14445 | 246 | 67 | 0.996 | 0.8527 | 0.5965 | 0.1 | 0.3 | 0.5 | 0.8 | 1.1 | 1.5 | 1.8 |
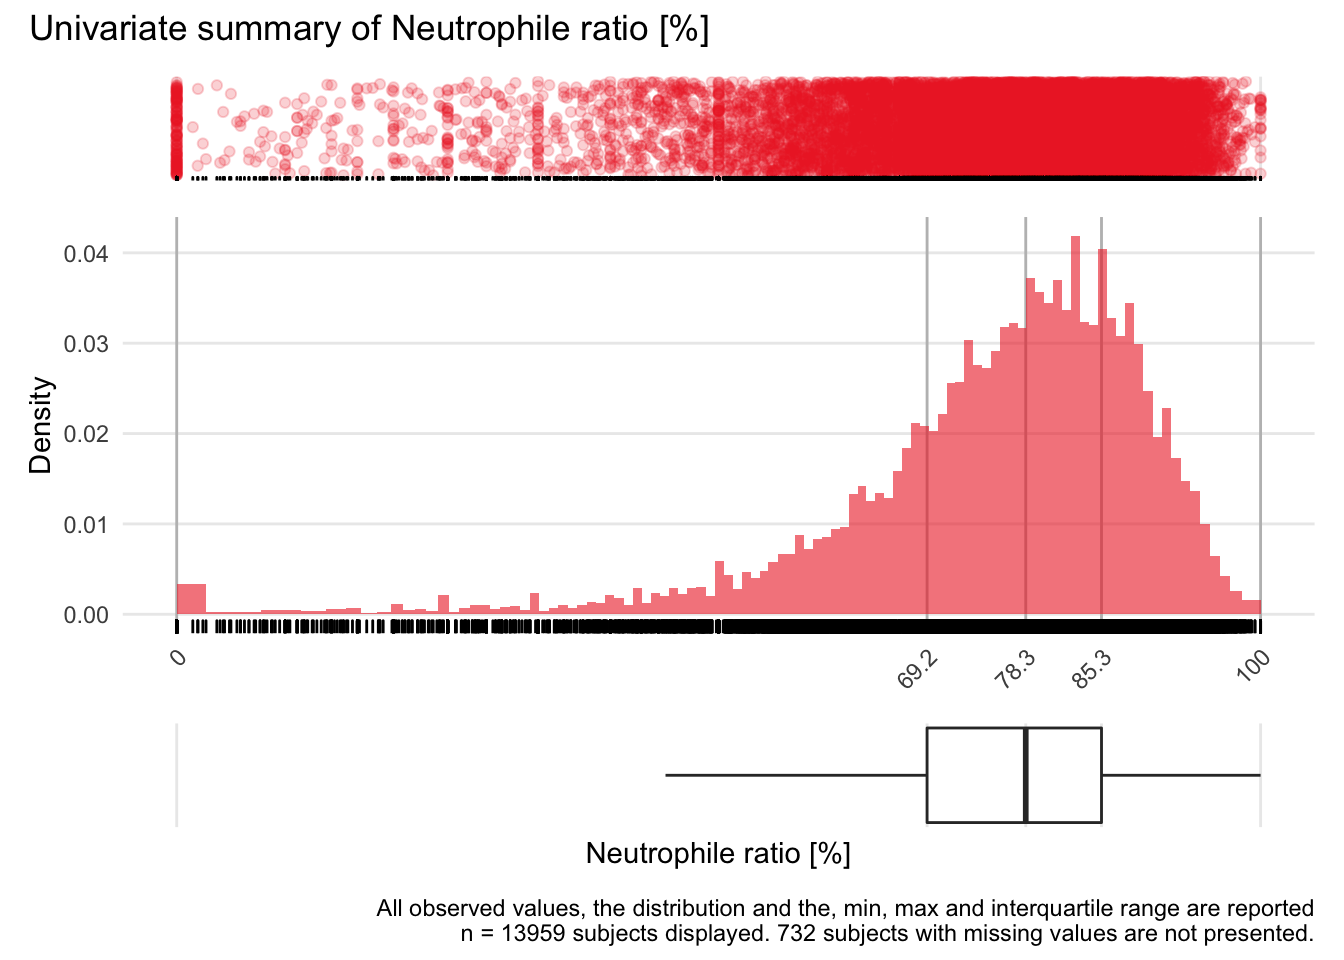
NEUR: Neutrophile ratio %

| n | missing | distinct | Info | Mean | Gmd | .05 | .10 | .25 | .50 | .75 | .90 | .95 |
|---|---|---|---|---|---|---|---|---|---|---|---|---|
| 13959 | 732 | 3850 | 1 | 75.15 | 15.6 | 47.42 | 57.88 | 69.23 | 78.33 | 85.32 | 90.13 | 92.63 |
| lowest : | 0.000000 | 1.484829 | 1.935484 | 1.960784 | 2.413793 |
| highest: | 99.122807 | 99.166667 | 99.476440 | 99.484536 | 100.000000 |
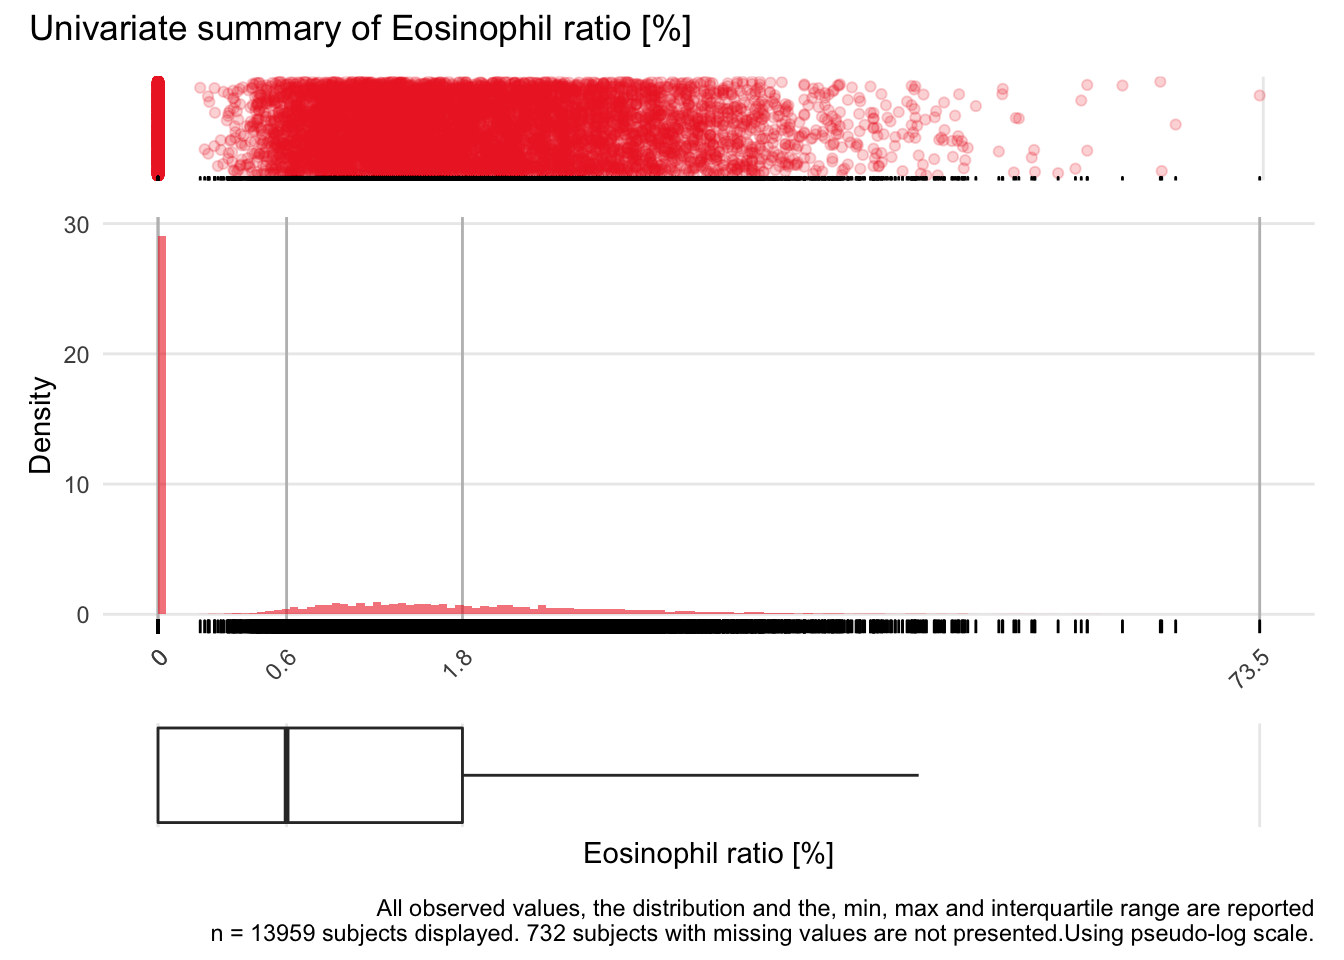
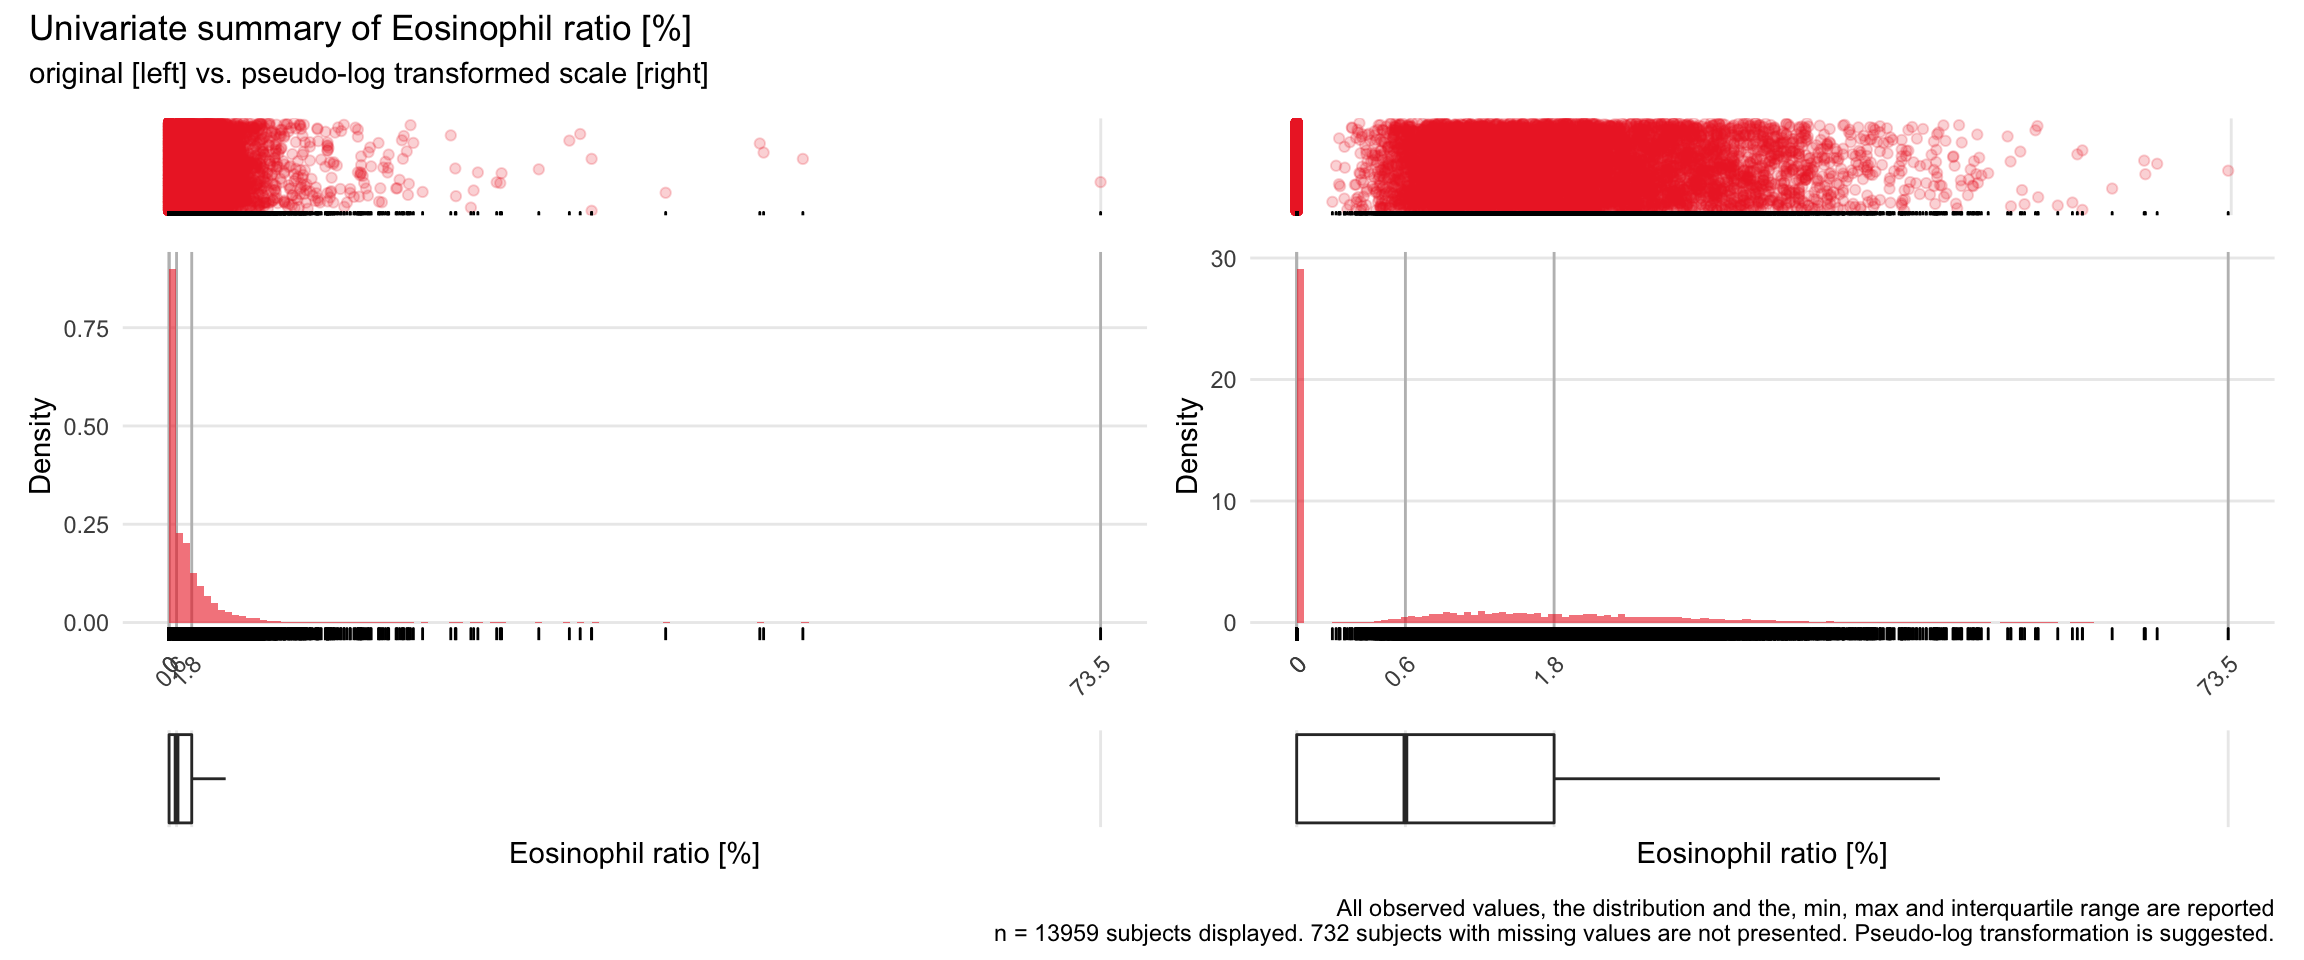
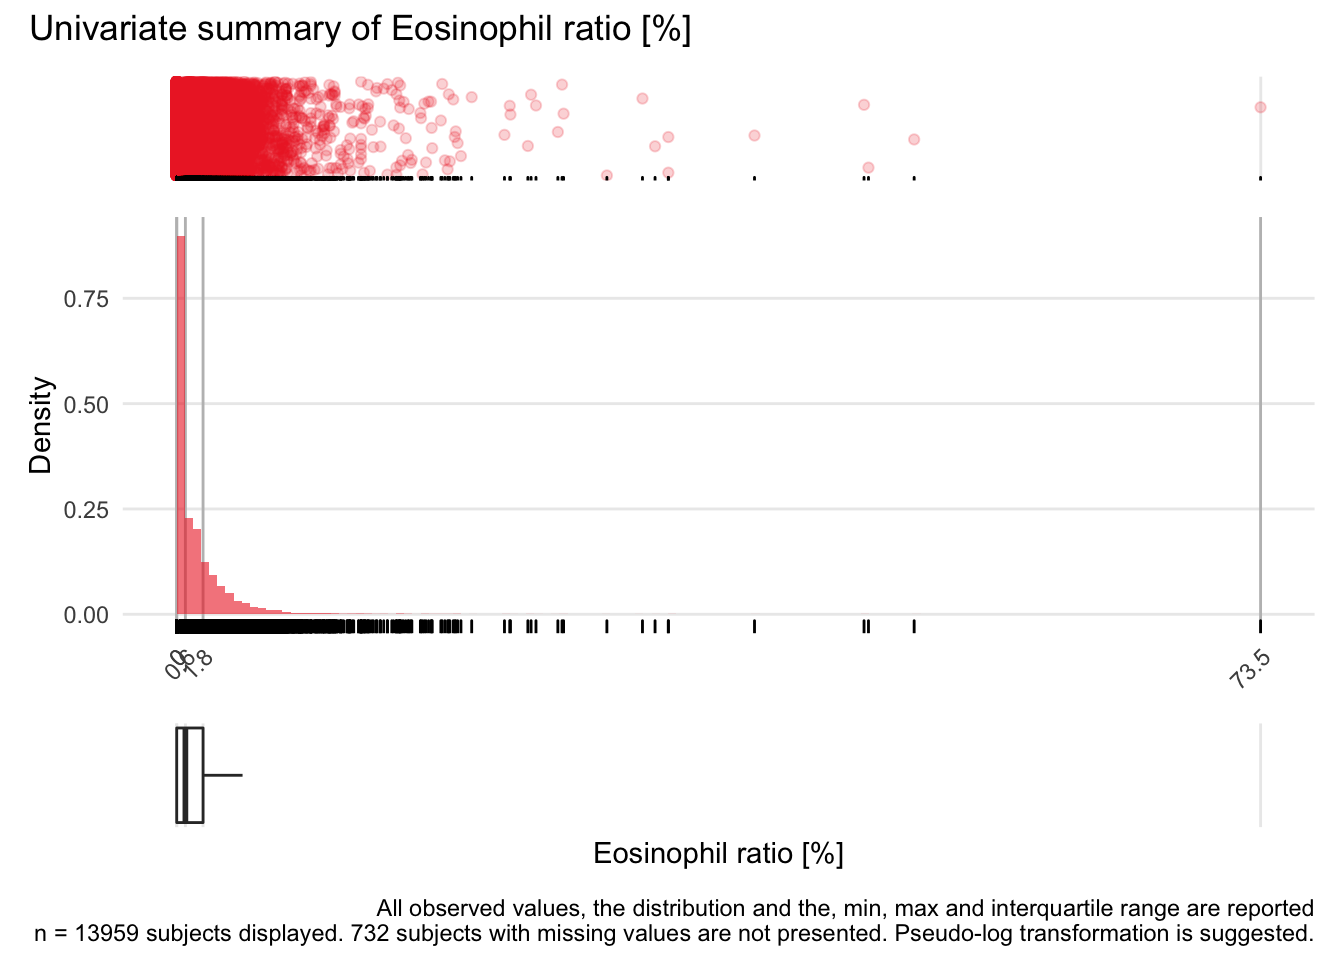
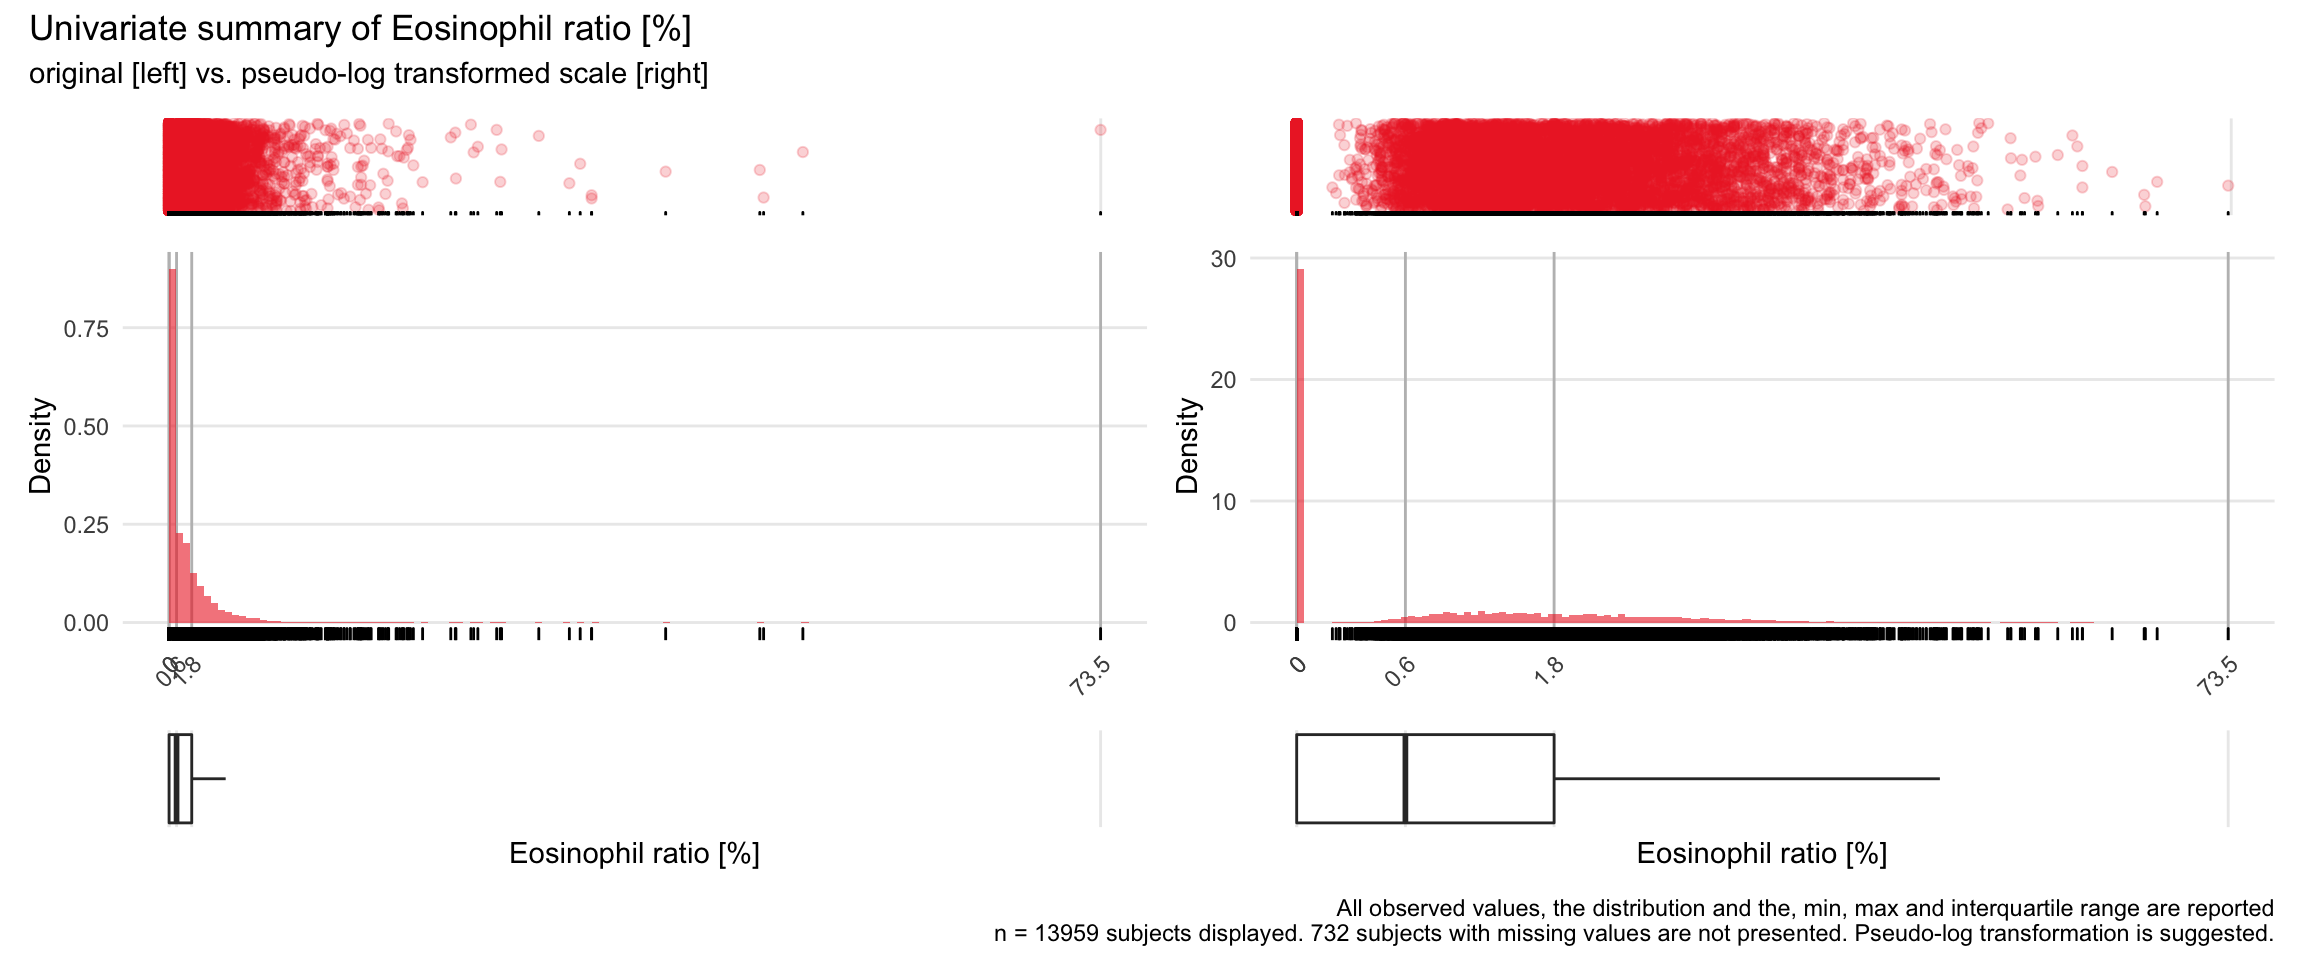
EOSR: Eosinophil ratio %

        n  missing distinct     Info     Mean      Gmd      .05      .10      .25
    13959      732      927    0.891    1.297    1.825   0.0000   0.0000   0.0000
      .50      .75      .90      .95
   0.5882   1.7857   3.4900   5.0000
| lowest : | 0.0000000 | 0.1834862 | 0.2028398 | 0.2178649 | 0.2188184 |
| highest: | 39.1752577 | 46.6019417 | 46.9026549 | 50.0000000 | 73.4883721 |
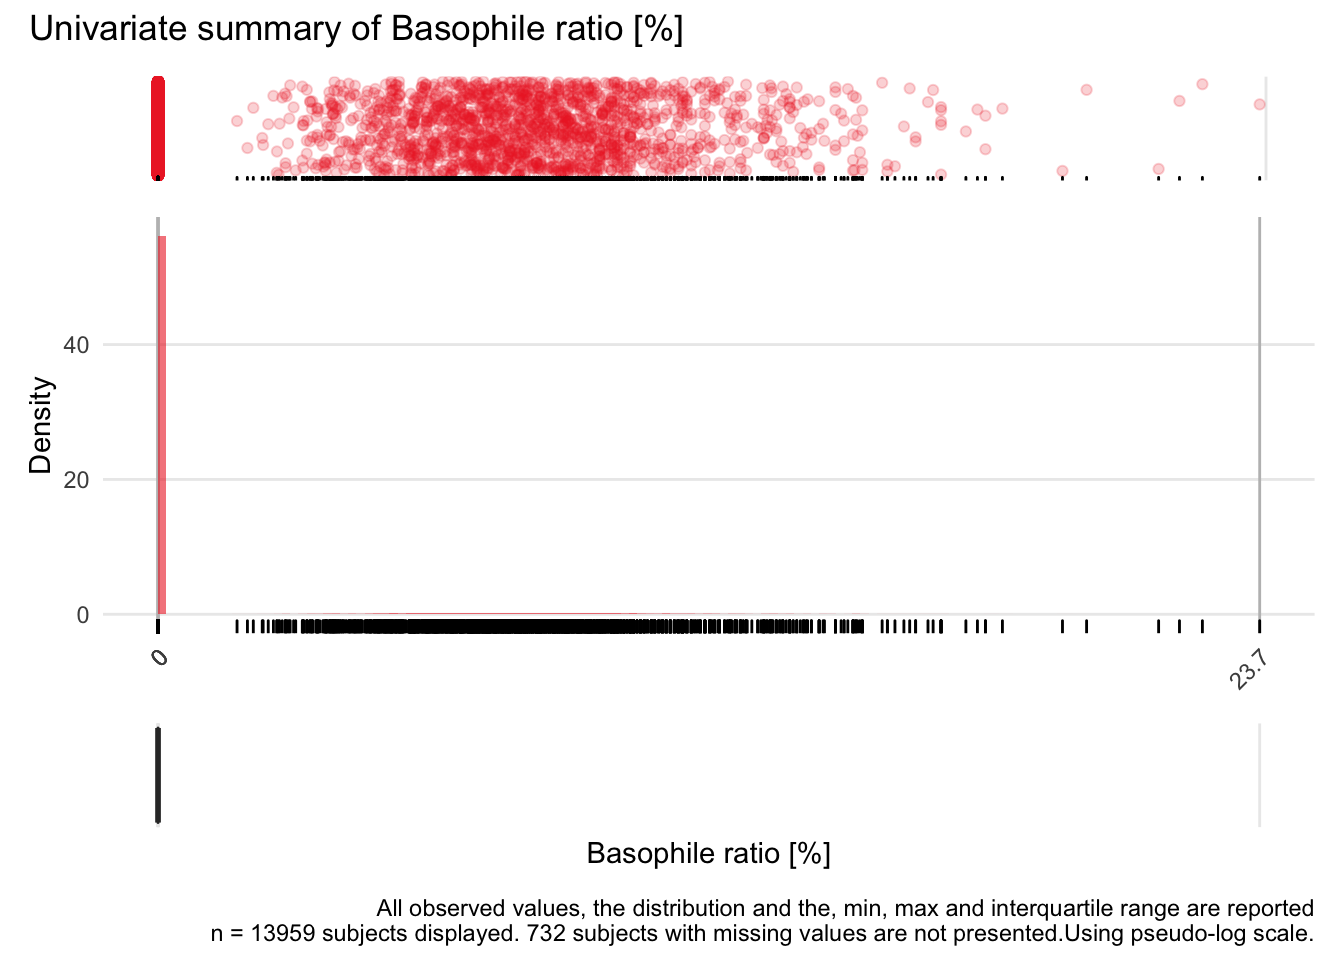
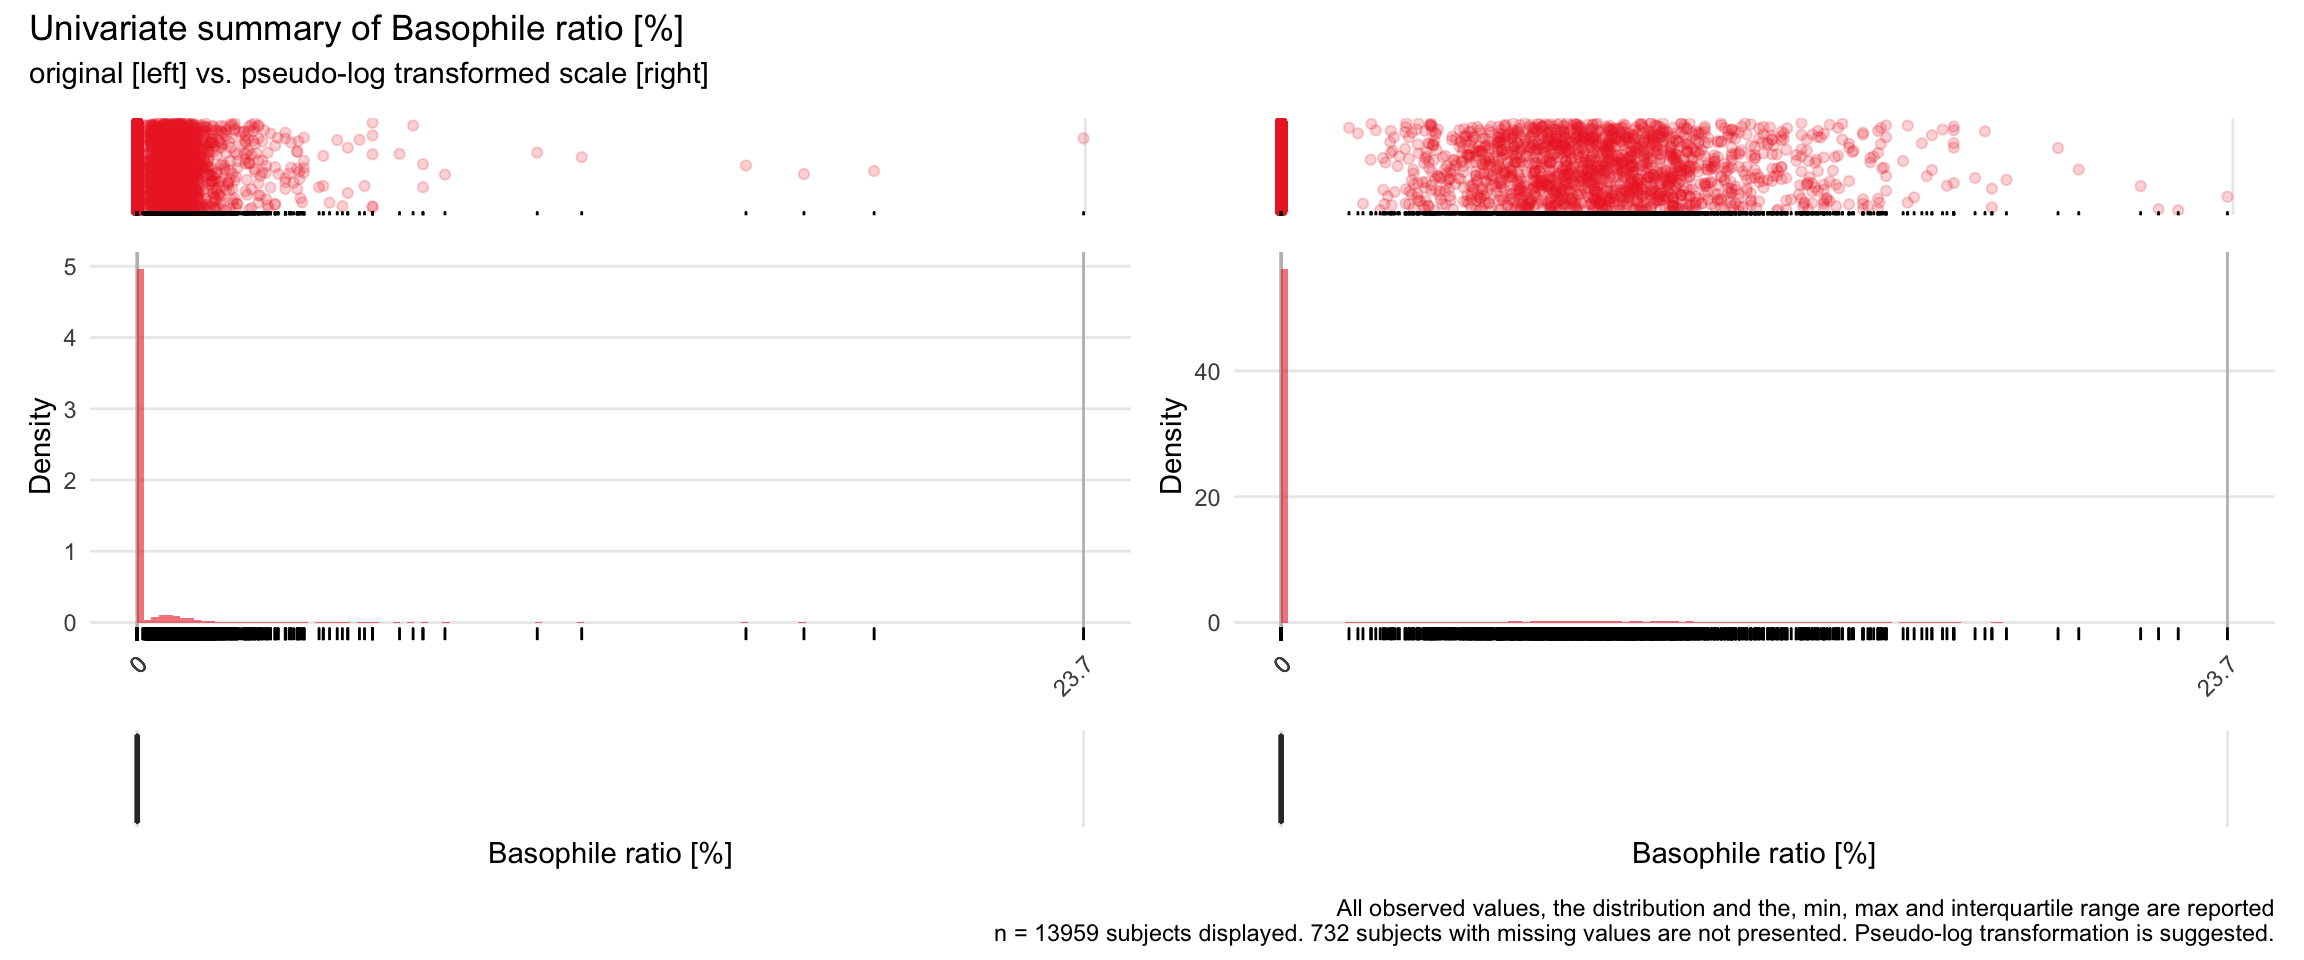
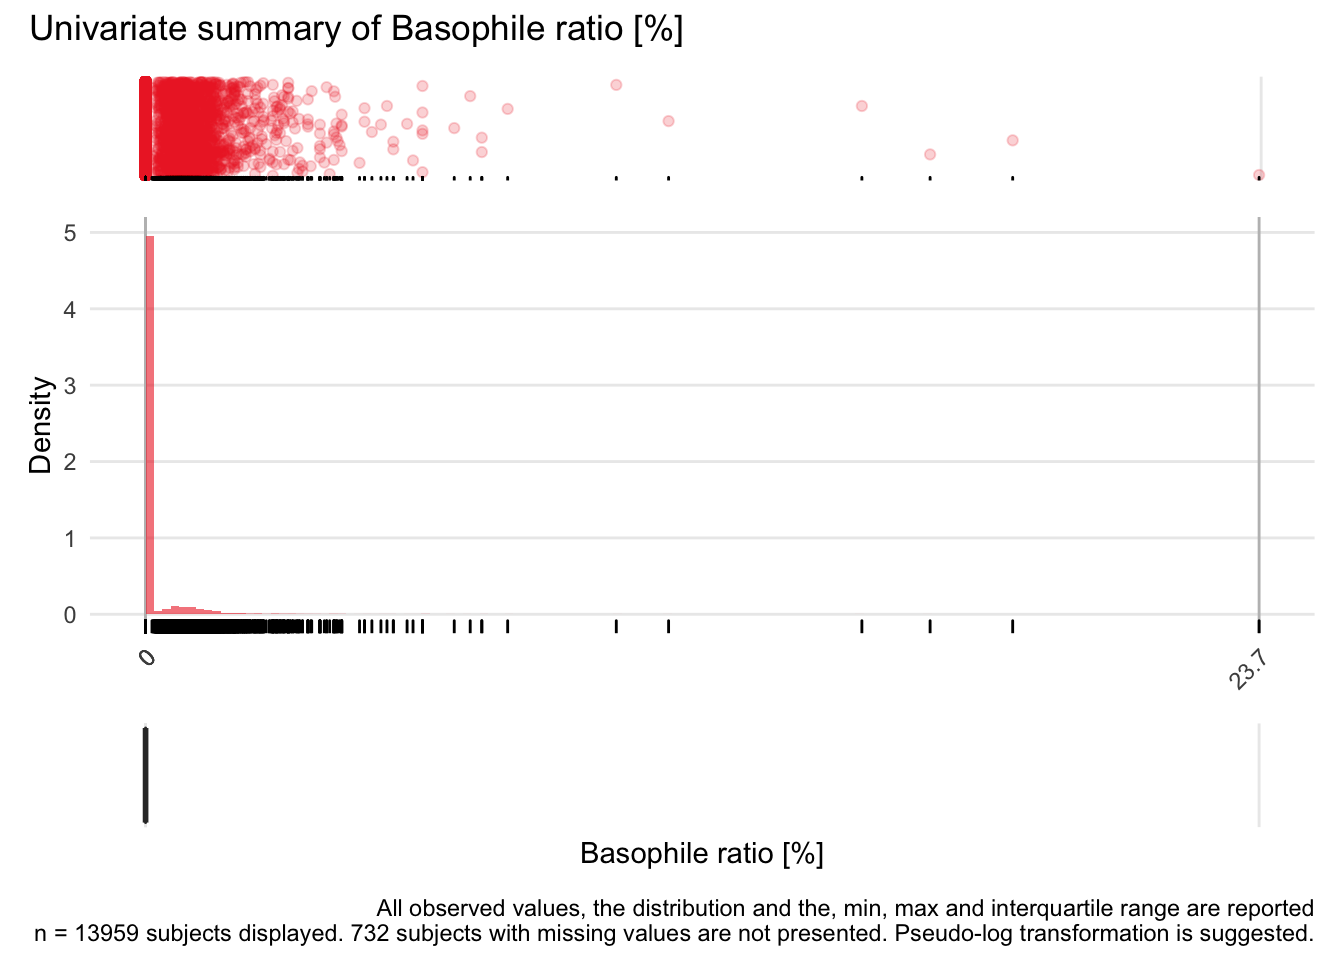
BASOR: Basophile ratio %

        n  missing distinct     Info     Mean      Gmd      .05      .10      .25
    13959      732      419    0.322    0.145   0.2679   0.0000   0.0000   0.0000
      .50      .75      .90      .95
   0.0000   0.0000   0.5501   1.0526
| lowest : | 0.0000000 | 0.1358696 | 0.1545595 | 0.1652893 | 0.1818182 |
| highest: | 11.1111111 | 15.2173913 | 16.6666667 | 18.4210526 | 23.6559140 |
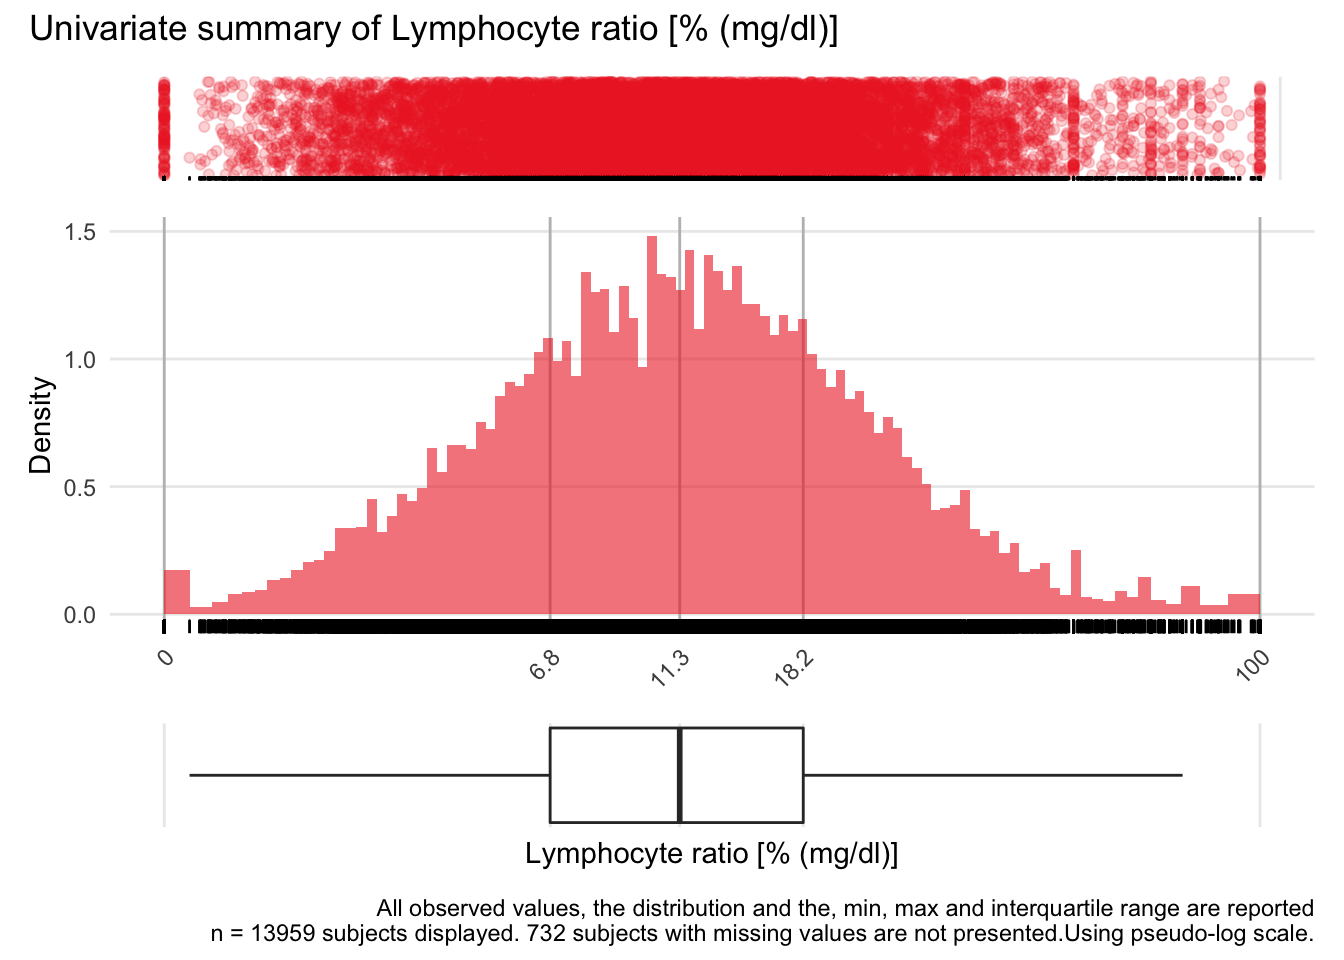
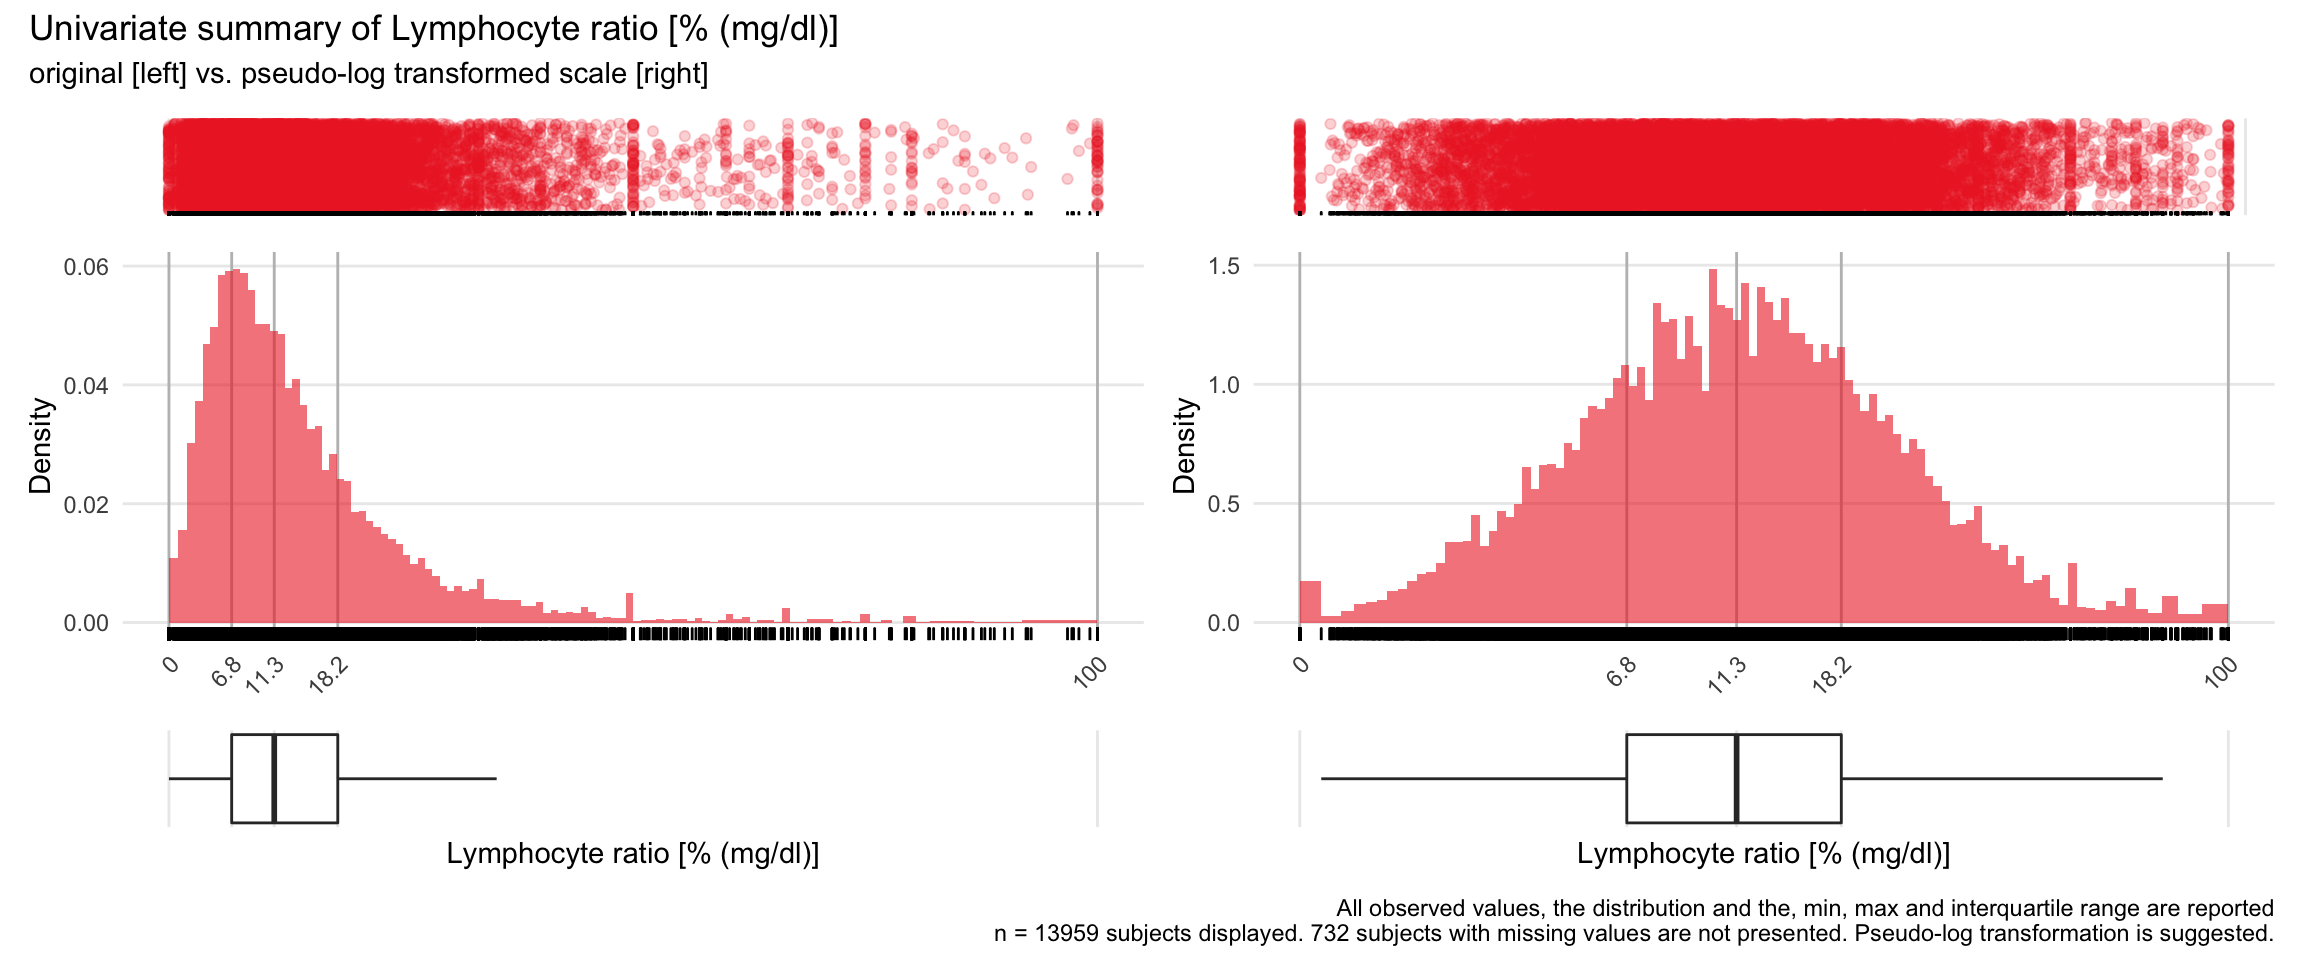
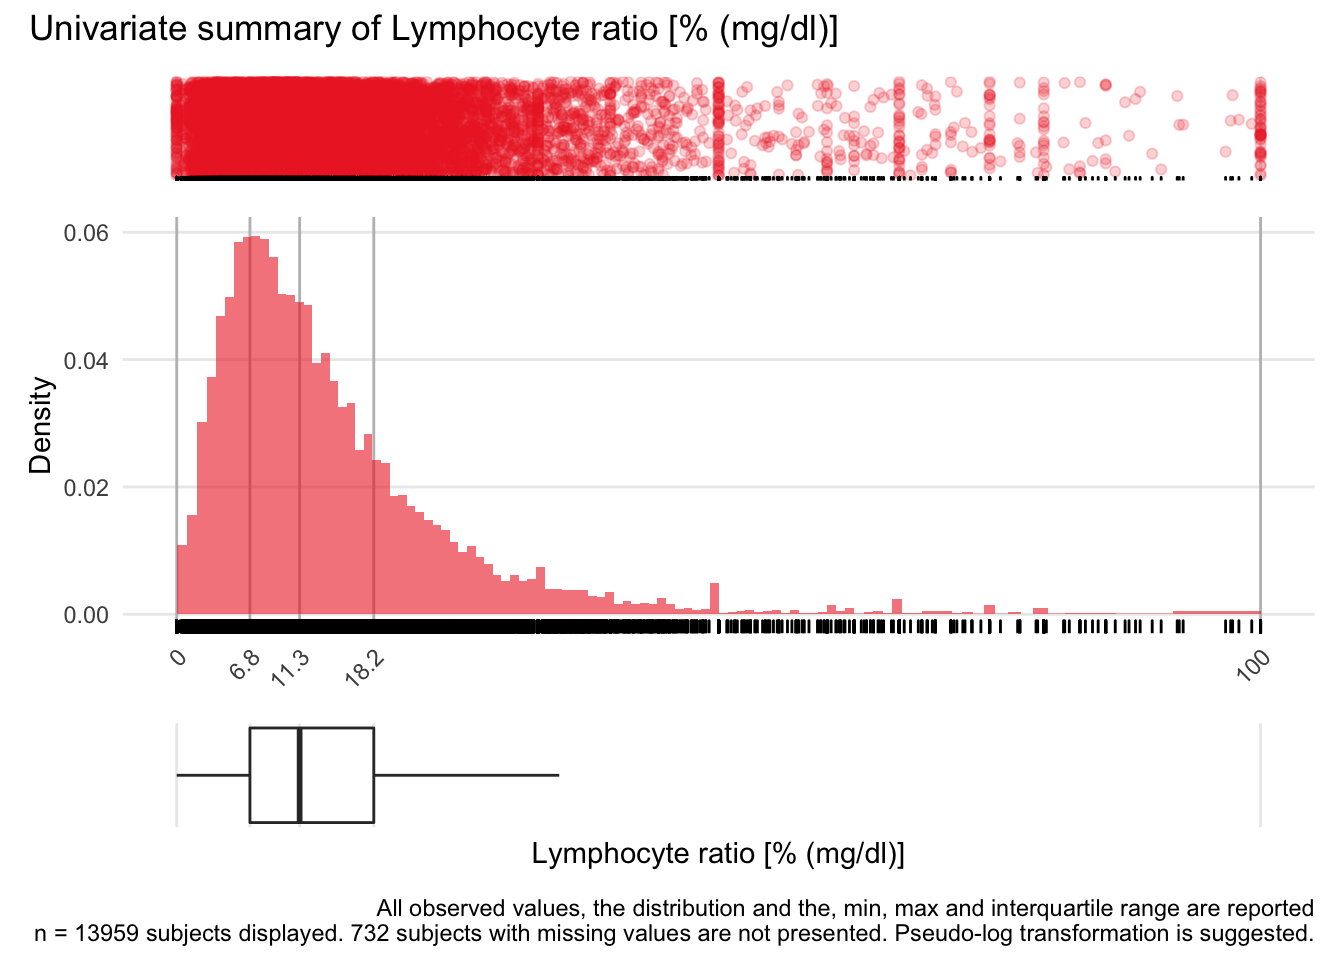
LYMR: Lymphocyte ratio % (mg/dl)

| n | missing | distinct | Info | Mean | Gmd | .05 | .10 | .25 | .50 | .75 | .90 | .95 |
|---|---|---|---|---|---|---|---|---|---|---|---|---|
| 13959 | 732 | 3121 | 1 | 14.61 | 11.87 | 2.752 | 4.000 | 6.757 | 11.340 | 18.182 | 27.869 | 36.620 |
| lowest : | 0.0000000 | 0.3215434 | 0.4484305 | 0.4608295 | 0.4636785 |
| highest: | 97.2413793 | 97.4193548 | 98.0000000 | 99.1847826 | 100.0000000 |
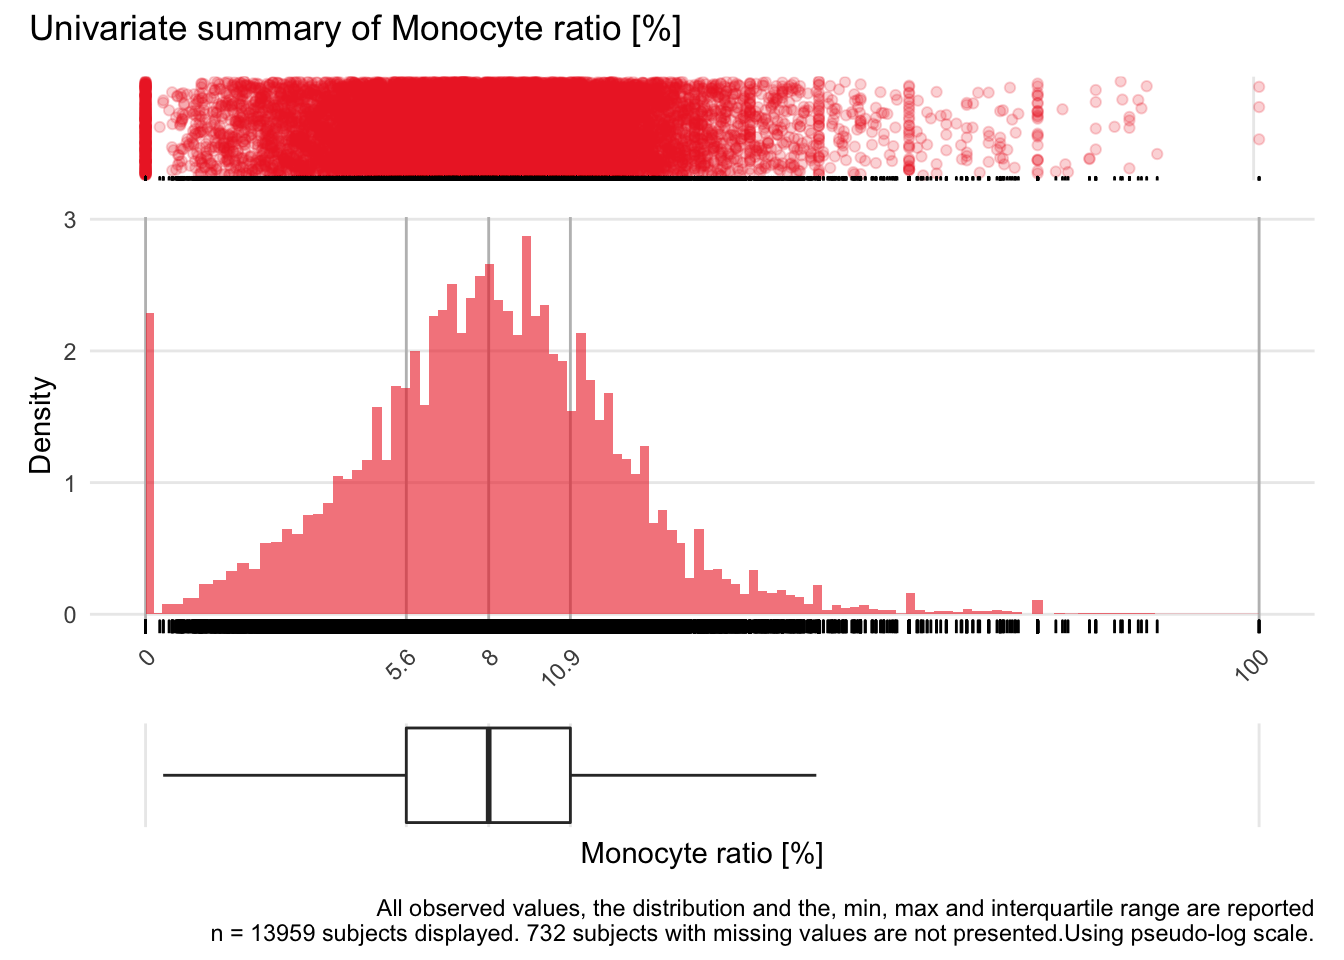
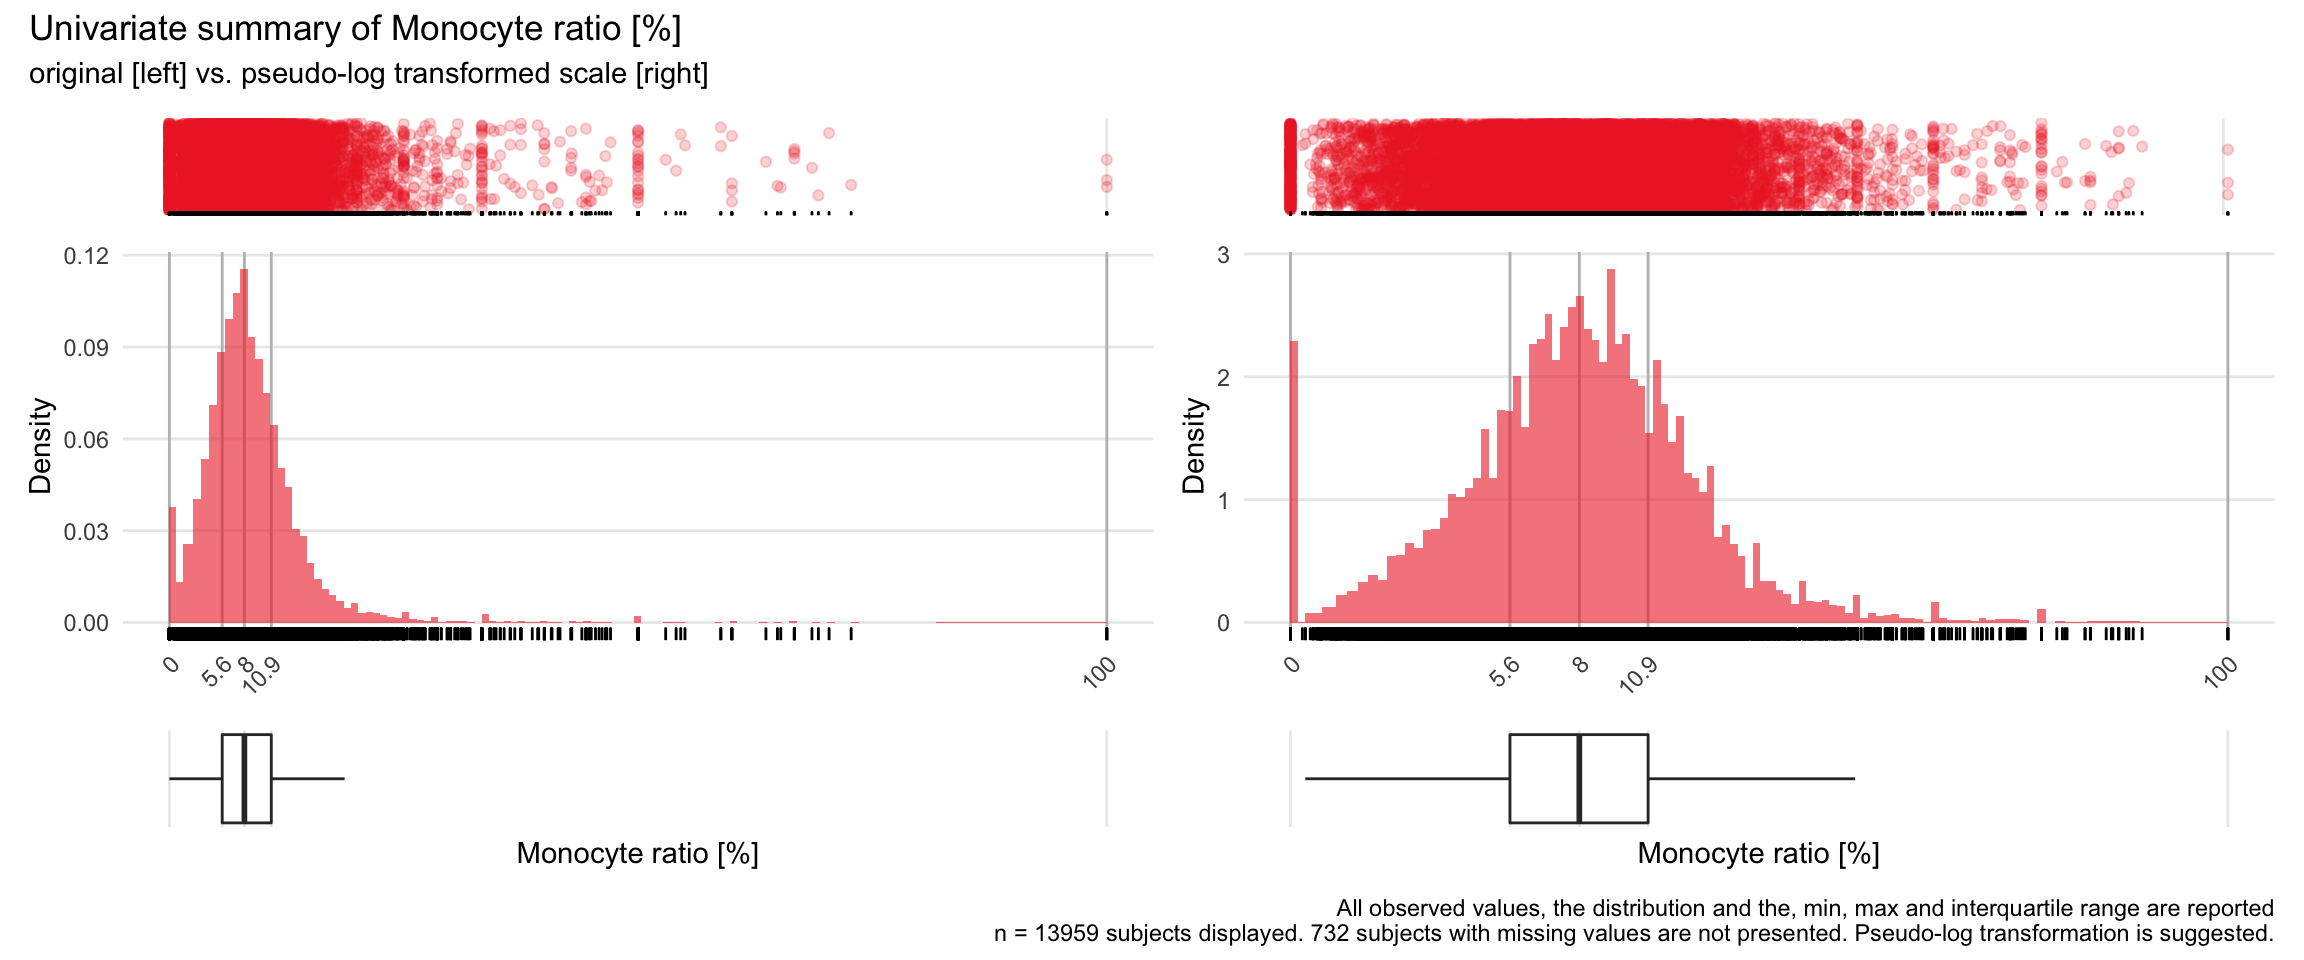
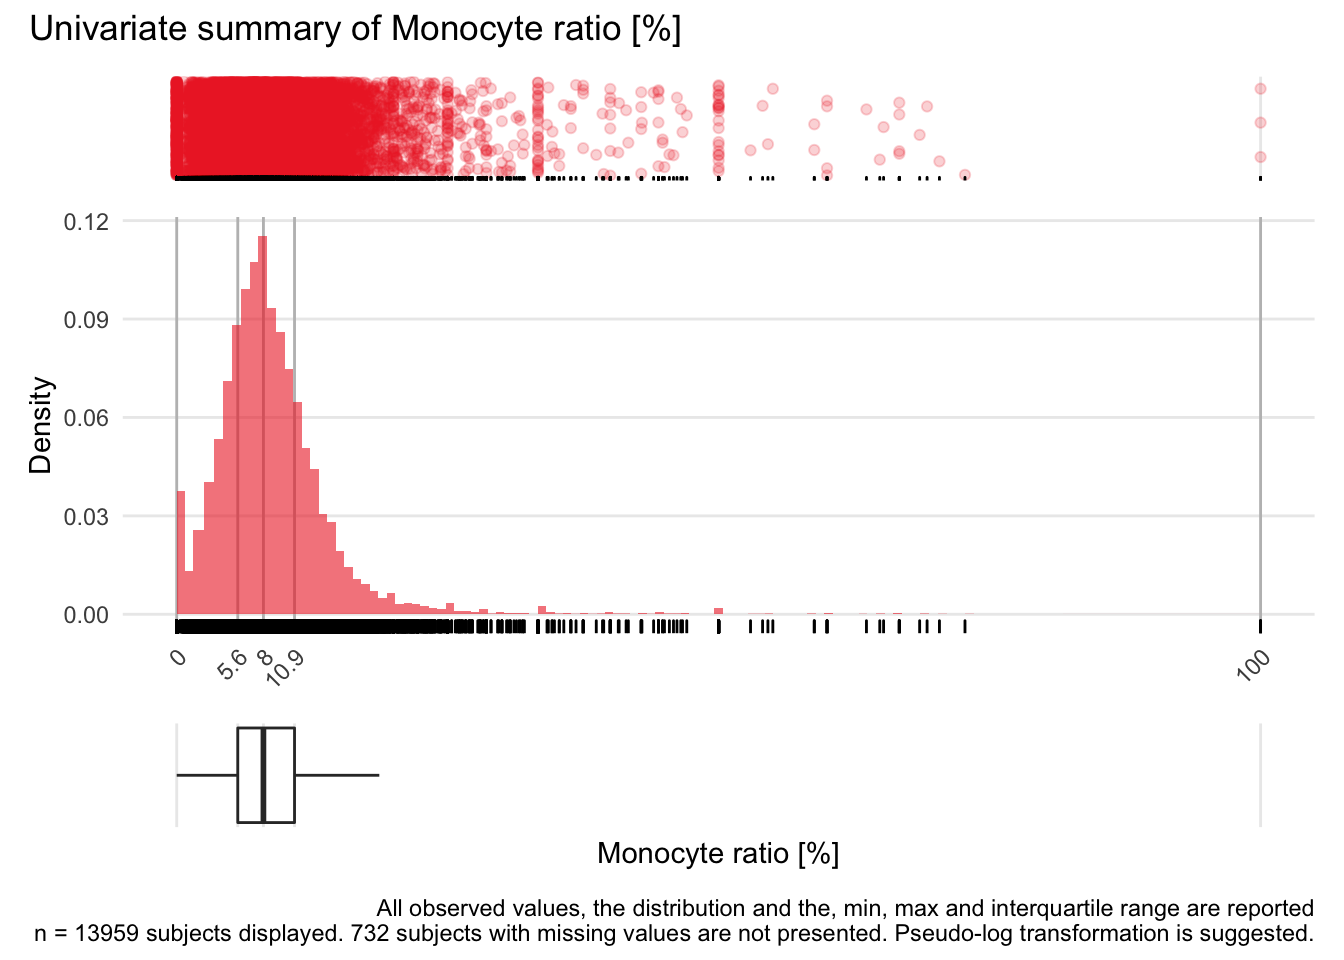
MONOR: Monocyte ratio %

| n | missing | distinct | Info | Mean | Gmd | .05 | .10 | .25 | .50 | .75 | .90 | .95 |
|---|---|---|---|---|---|---|---|---|---|---|---|---|
| 13959 | 732 | 2334 | 1 | 8.793 | 5.4 | 2.000 | 3.390 | 5.634 | 8.000 | 10.870 | 14.141 | 17.021 |
| lowest : | 0.0000000 | 0.2747253 | 0.3412969 | 0.3448276 | 0.4566210 |
| highest: | 68.5446009 | 69.2307692 | 70.3703704 | 72.7272727 | 100.0000000 |
8.1.4 Kidney function related variables
5 Variables 14691 Observations
BUN: Blood urea nitrogen mg/dl
| n | missing | distinct | Info | Mean | Gmd | .05 | .10 | .25 | .50 | .75 | .90 | .95 |
|---|---|---|---|---|---|---|---|---|---|---|---|---|
| 14519 | 172 | 947 | 1 | 22.66 | 16.92 | 7.1 | 8.6 | 11.6 | 16.6 | 26.9 | 44.8 | 60.8 |
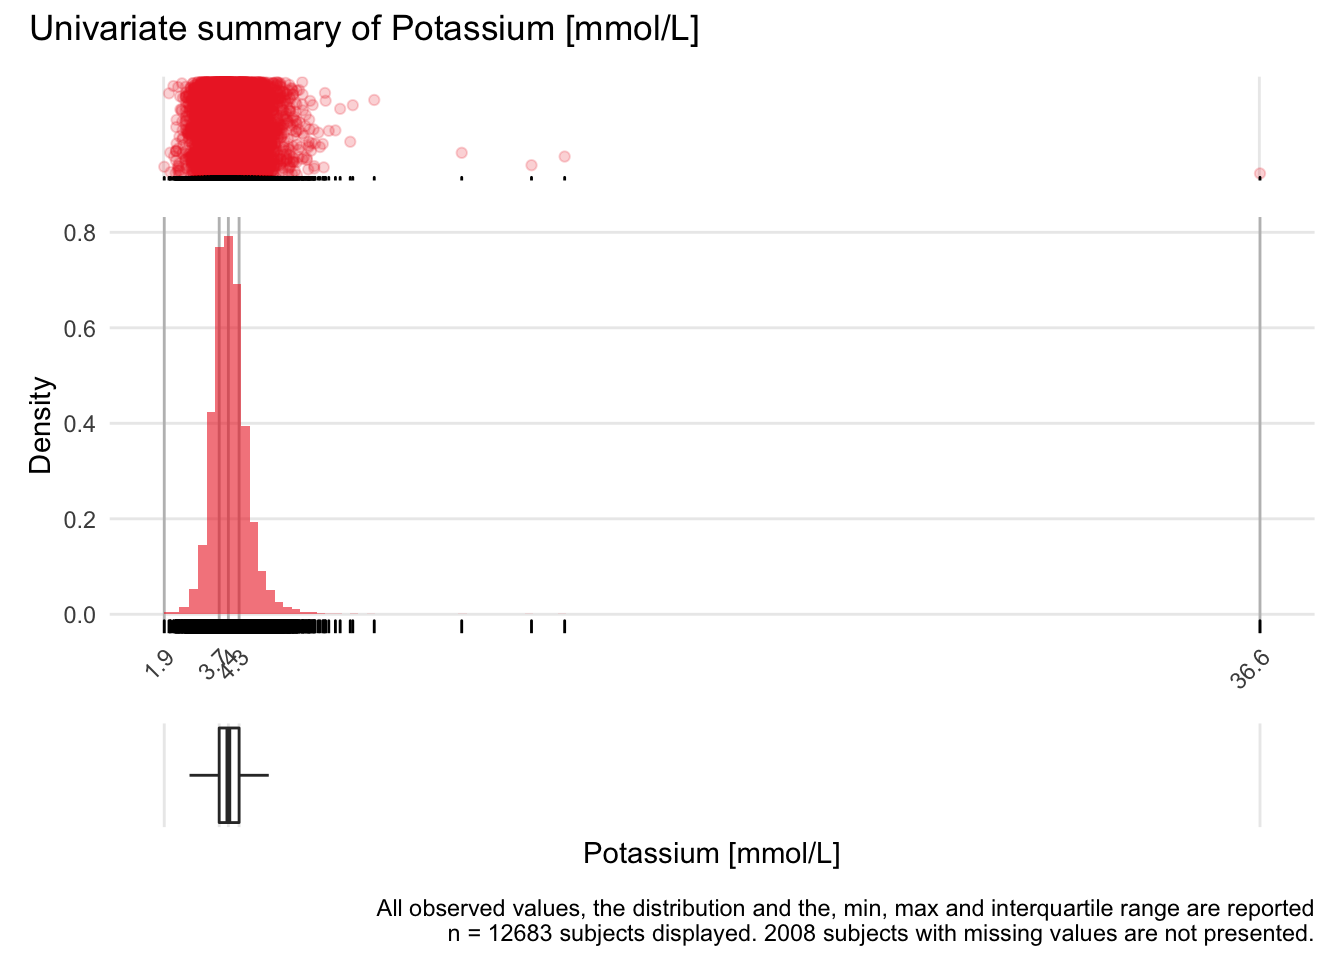
POTASS: Potassium mmol/L

| n | missing | distinct | Info | Mean | Gmd | .05 | .10 | .25 | .50 | .75 | .90 | .95 |
|---|---|---|---|---|---|---|---|---|---|---|---|---|
| 12683 | 2008 | 408 | 1 | 4.003 | 0.6004 | 3.20 | 3.39 | 3.66 | 3.95 | 4.29 | 4.67 | 4.92 |
 Value        2.0   2.5   3.0   3.5   4.0   4.5   5.0   5.5   6.0   6.5   7.0   7.5
 Frequency      6    91   650  3385  5088  2455   692   201    73    26     7     2
 Proportion 0.000 0.007 0.051 0.267 0.401 0.194 0.055 0.016 0.006 0.002 0.001 0.000

 Value        8.0   8.5  11.5  13.5  14.5  36.5
 Frequency      2     1     1     1     1     1
 Proportion 0.000 0.000 0.000 0.000 0.000 0.000
For the frequency table, variable is rounded to the nearest 0.5 CREA: Creatinine mg/dl
| n | missing | distinct | Info | Mean | Gmd | .05 | .10 | .25 | .50 | .75 | .90 | .95 |
|---|---|---|---|---|---|---|---|---|---|---|---|---|
| 14532 | 159 | 674 | 1 | 1.329 | 0.8518 | 0.620 | 0.690 | 0.810 | 1.000 | 1.350 | 2.160 | 3.144 |
eGFR: estimated glomerular filtration rate mL/min/1.73 m2

| n | missing | distinct | Info | Mean | Gmd | .05 | .10 | .25 | .50 | .75 | .90 | .95 |
|---|---|---|---|---|---|---|---|---|---|---|---|---|
| 14532 | 159 | 9708 | 1 | 72.14 | 35.06 | 17.52 | 27.21 | 49.70 | 75.59 | 95.22 | 109.76 | 118.09 |
| lowest : | 2.430496 | 2.644088 | 2.783769 | 2.874308 | 2.901780 |
| highest: | 162.497066 | 163.668639 | 165.504354 | 169.958856 | 175.747773 |
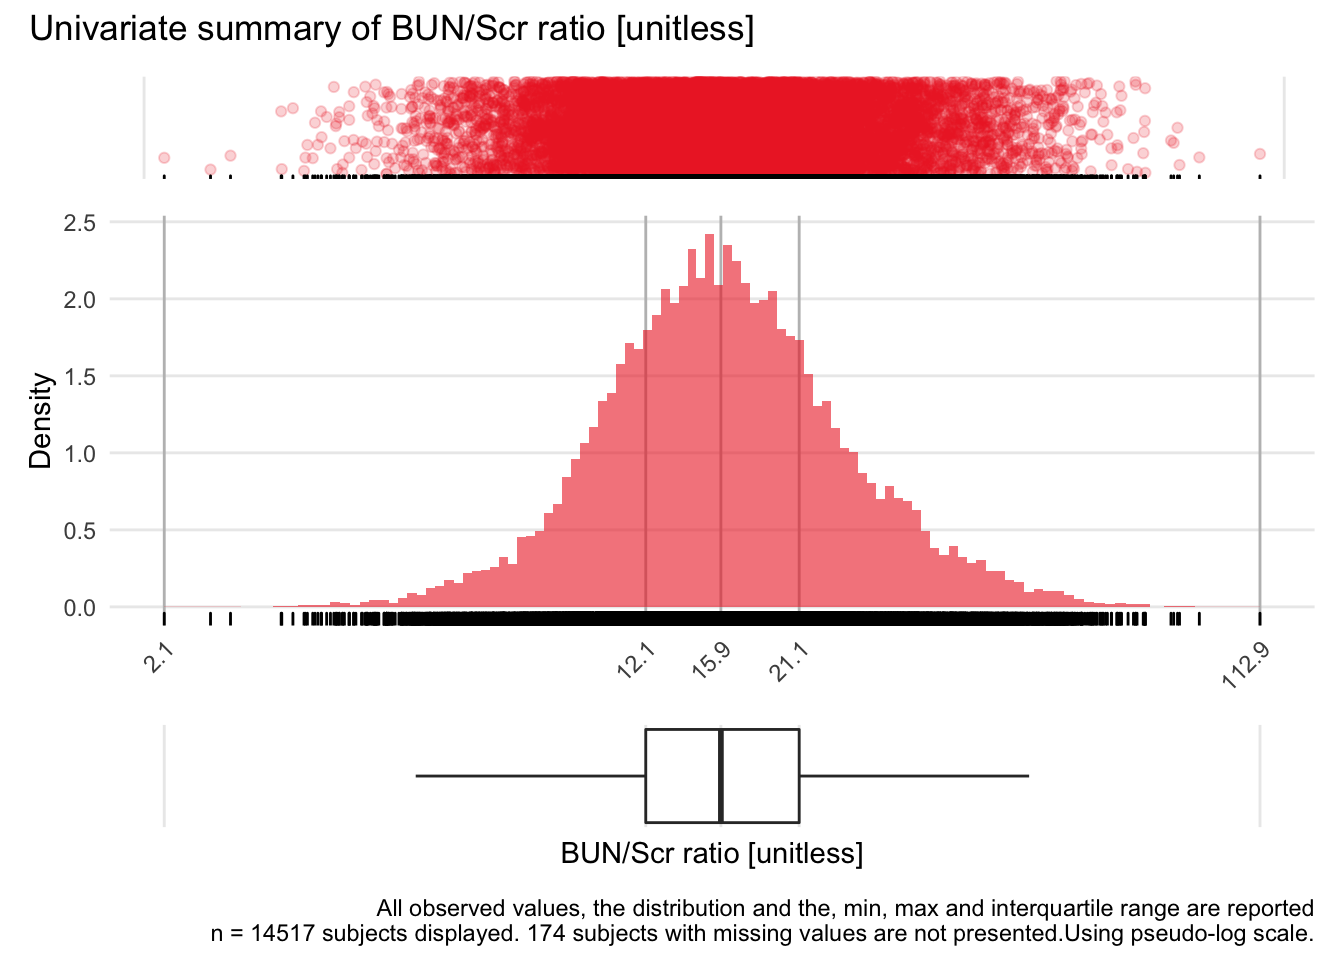
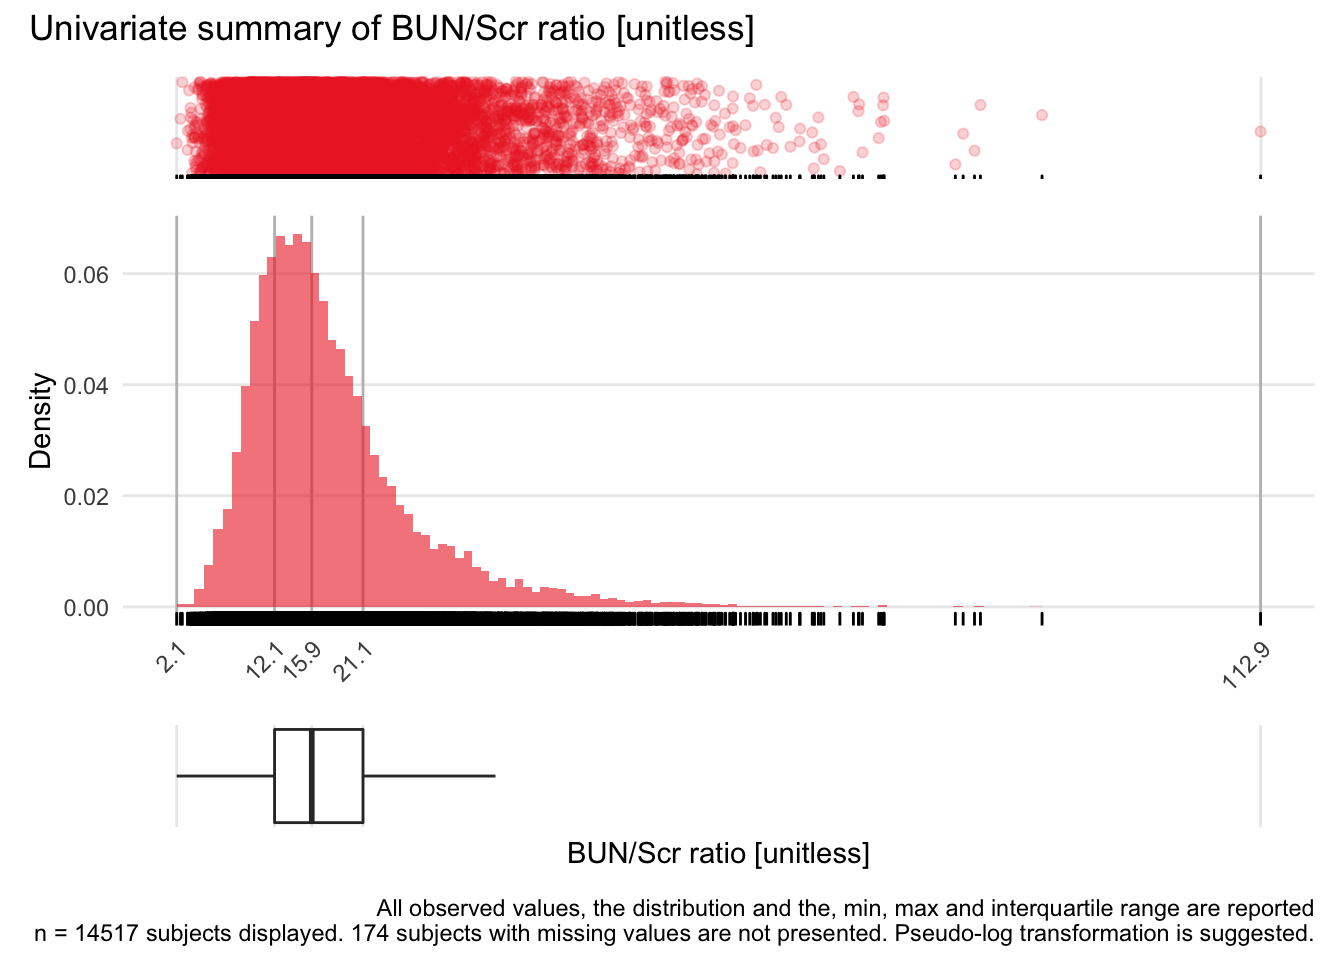
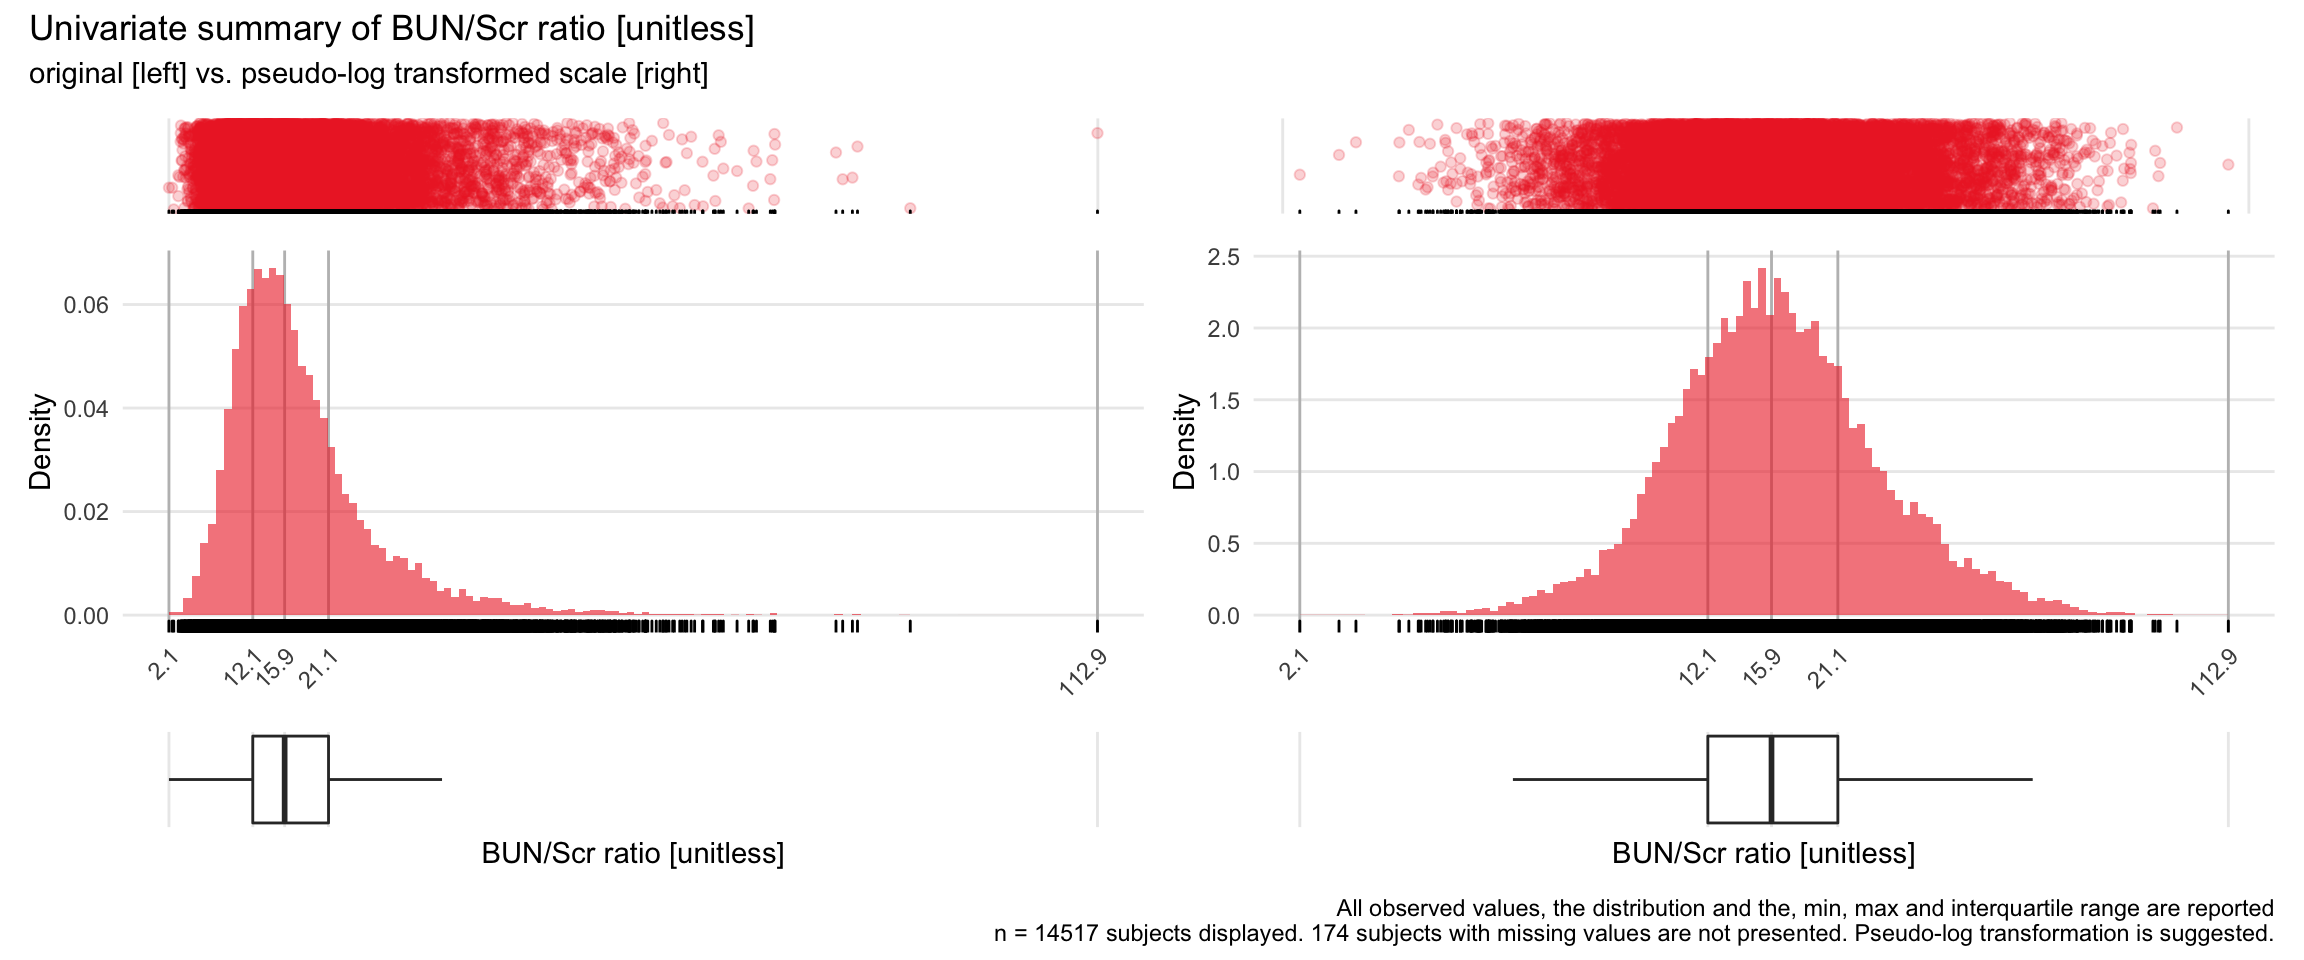
BUN_CREA: BUN/Scr ratio unitless

| n | missing | distinct | Info | Mean | Gmd | .05 | .10 | .25 | .50 | .75 | .90 | .95 |
|---|---|---|---|---|---|---|---|---|---|---|---|---|
| 14517 | 174 | 9708 | 1 | 17.87 | 8.898 | 8.048 | 9.482 | 12.101 | 15.902 | 21.136 | 28.906 | 34.683 |
| lowest : | 2.101990 | 2.486957 | 2.674419 | 3.215339 | 3.222222 |
| highest: | 82.463768 | 83.625000 | 84.230769 | 90.526316 | 112.857143 |
8.1.5 Acute phase reaction related variables
5 Variables 14691 Observations
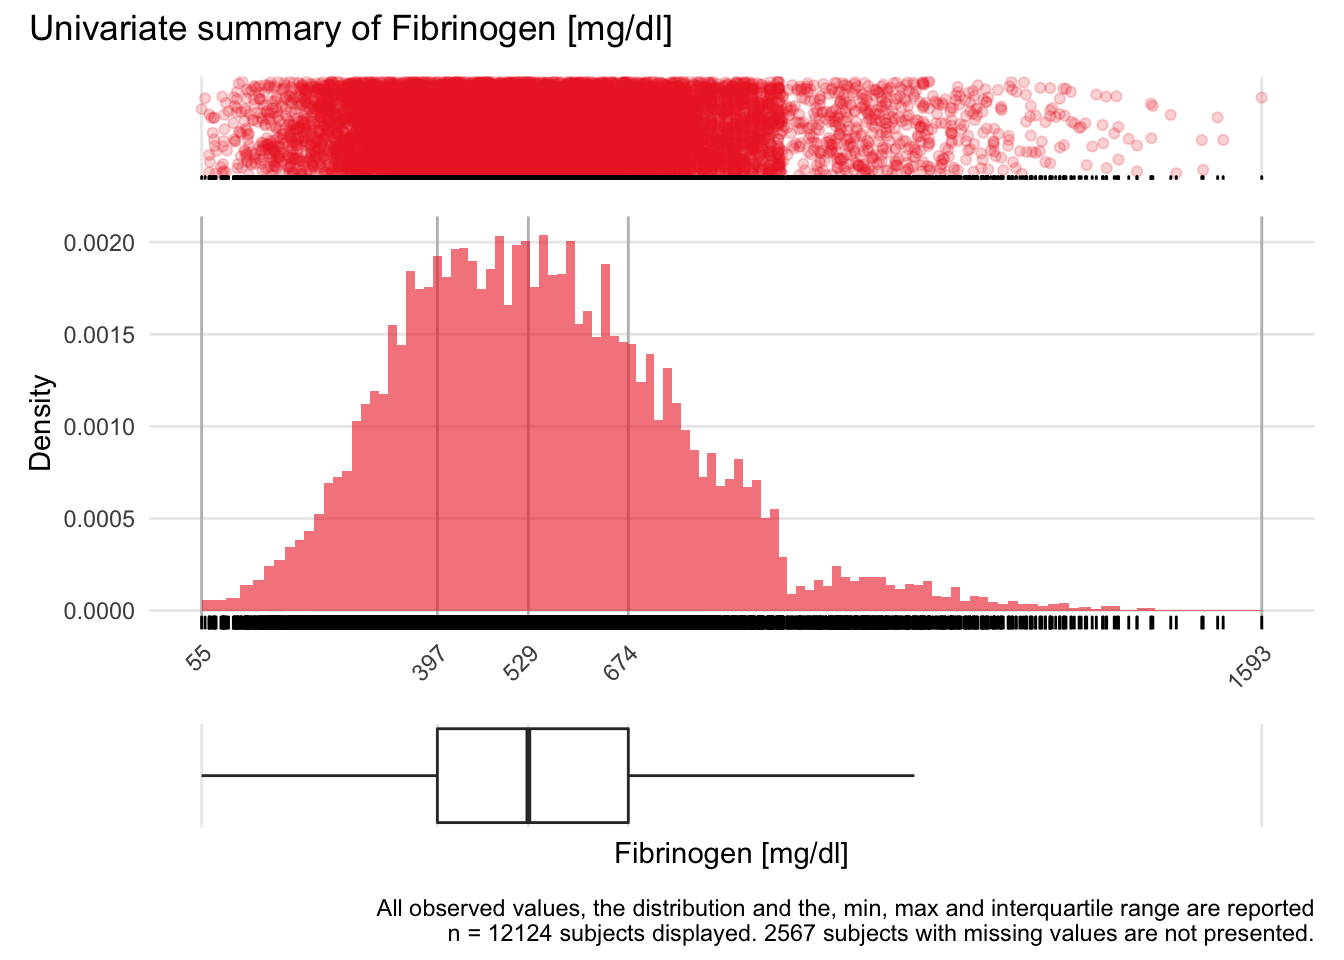
FIB: Fibrinogen mg/dl

| n | missing | distinct | Info | Mean | Gmd | .05 | .10 | .25 | .50 | .75 | .90 | .95 |
|---|---|---|---|---|---|---|---|---|---|---|---|---|
| 12124 | 2567 | 1084 | 1 | 547.4 | 231 | 247 | 301 | 397 | 529 | 674 | 816 | 892 |
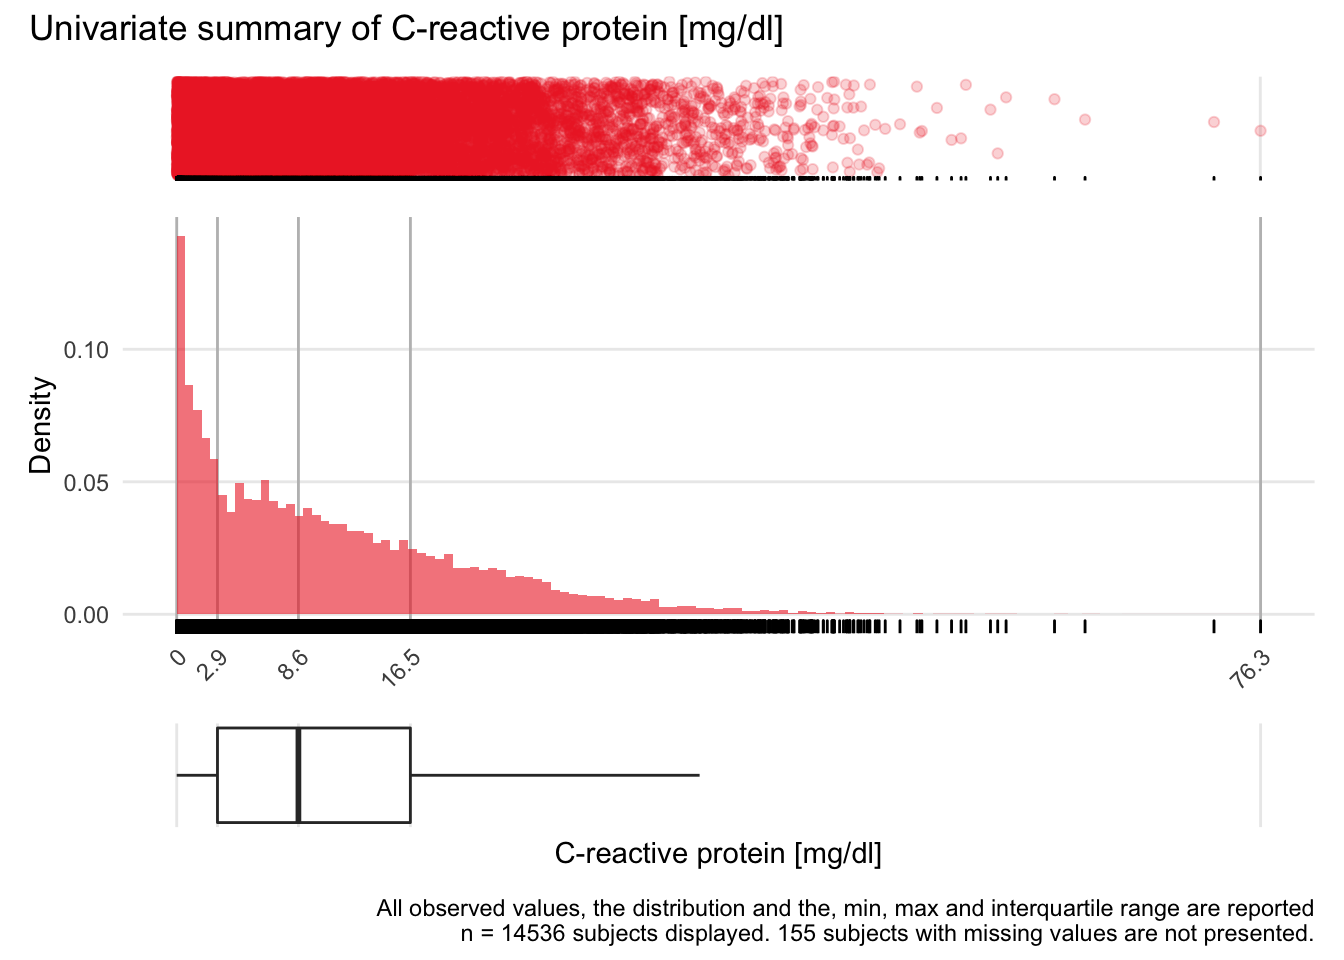
CRP: C-reactive protein mg/dl

| n | missing | distinct | Info | Mean | Gmd | .05 | .10 | .25 | .50 | .75 | .90 | .95 |
|---|---|---|---|---|---|---|---|---|---|---|---|---|
| 14536 | 155 | 3328 | 1 | 10.92 | 10.39 | 0.29 | 0.77 | 2.87 | 8.57 | 16.45 | 24.49 | 29.61 |
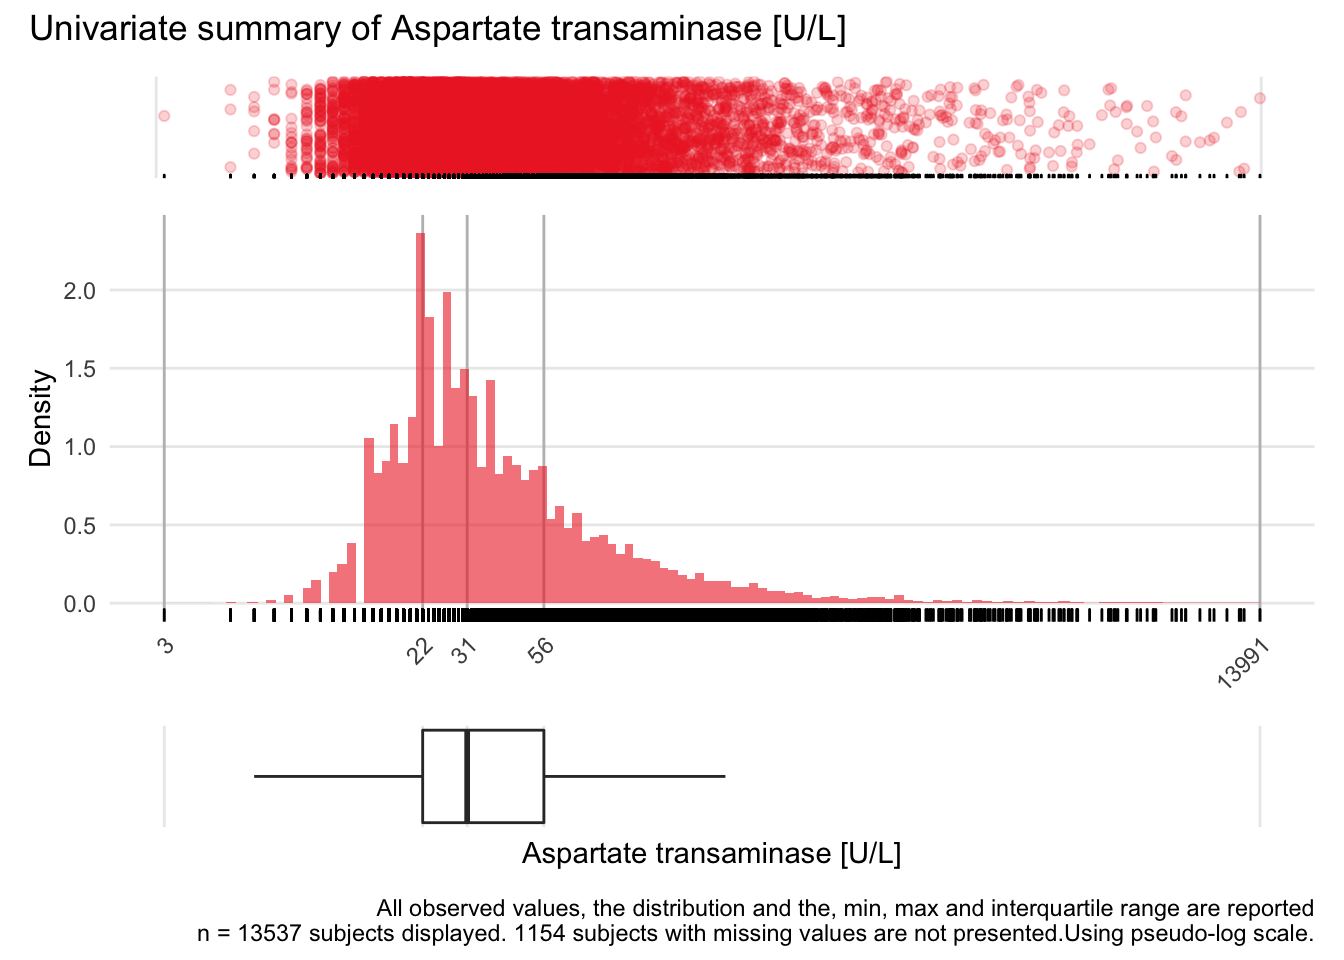
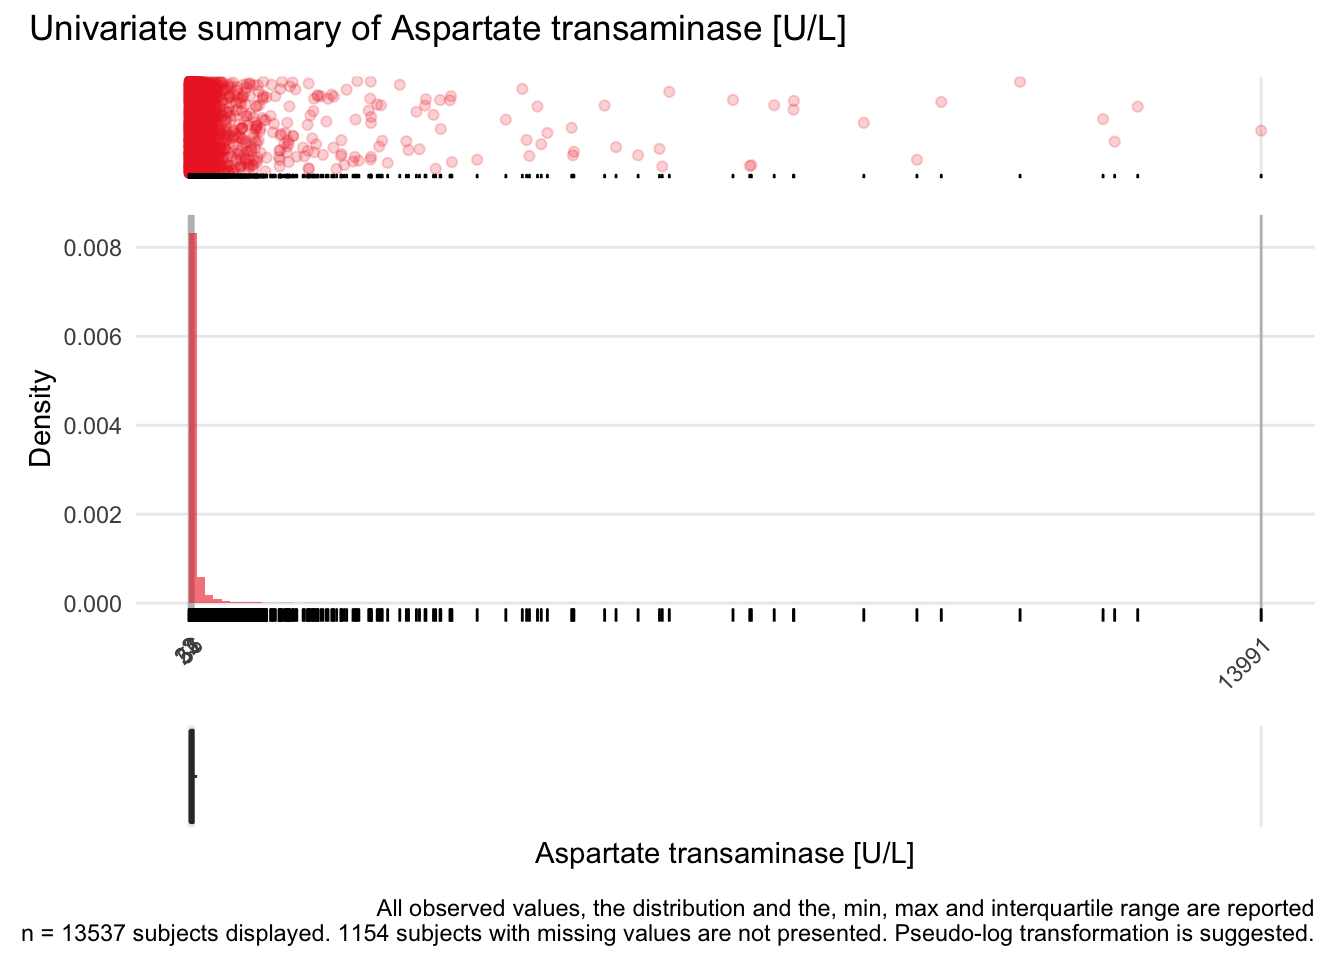
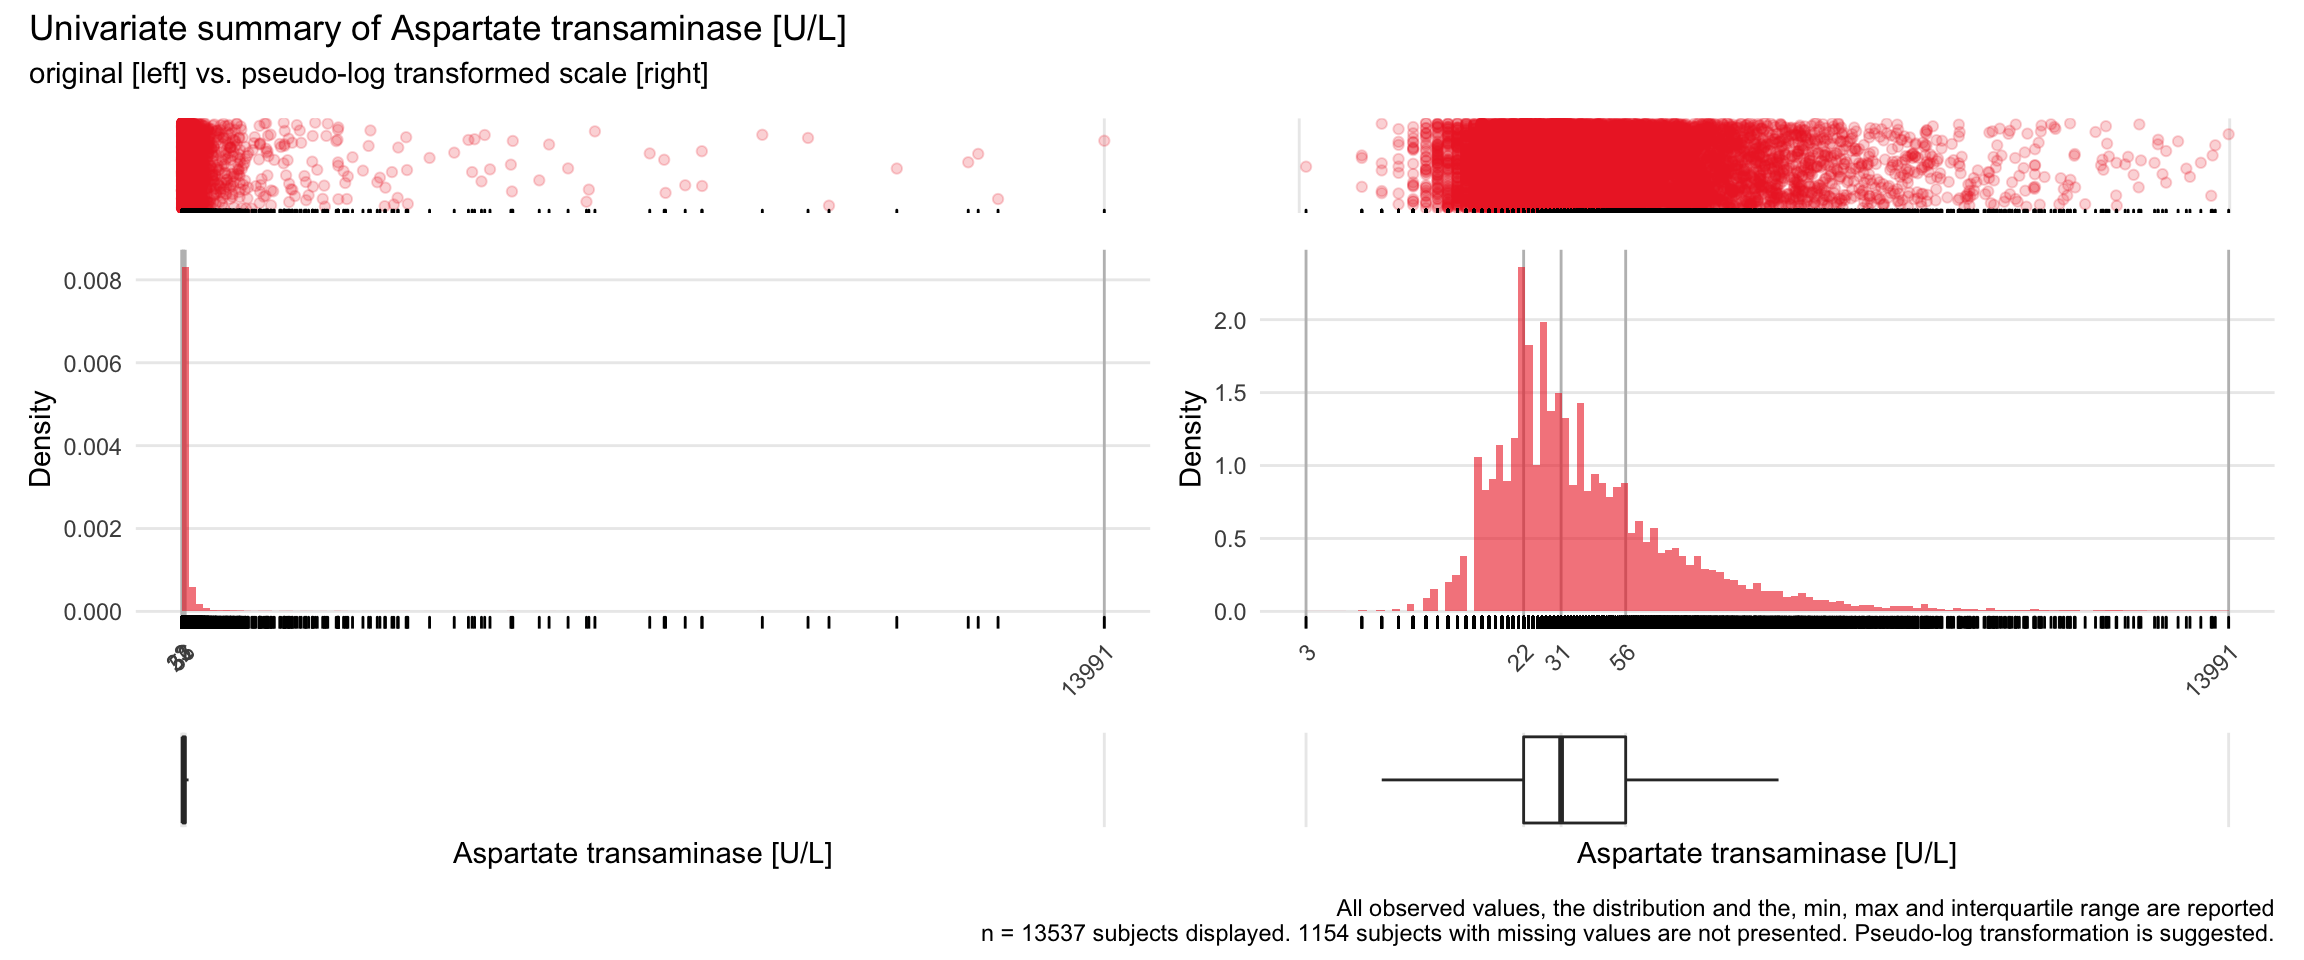
ASAT: Aspartate transaminase U/L

| n | missing | distinct | Info | Mean | Gmd | .05 | .10 | .25 | .50 | .75 | .90 | .95 |
|---|---|---|---|---|---|---|---|---|---|---|---|---|
| 13537 | 1154 | 650 | 1 | 86.9 | 115.6 | 15 | 17 | 22 | 31 | 56 | 121 | 218 |
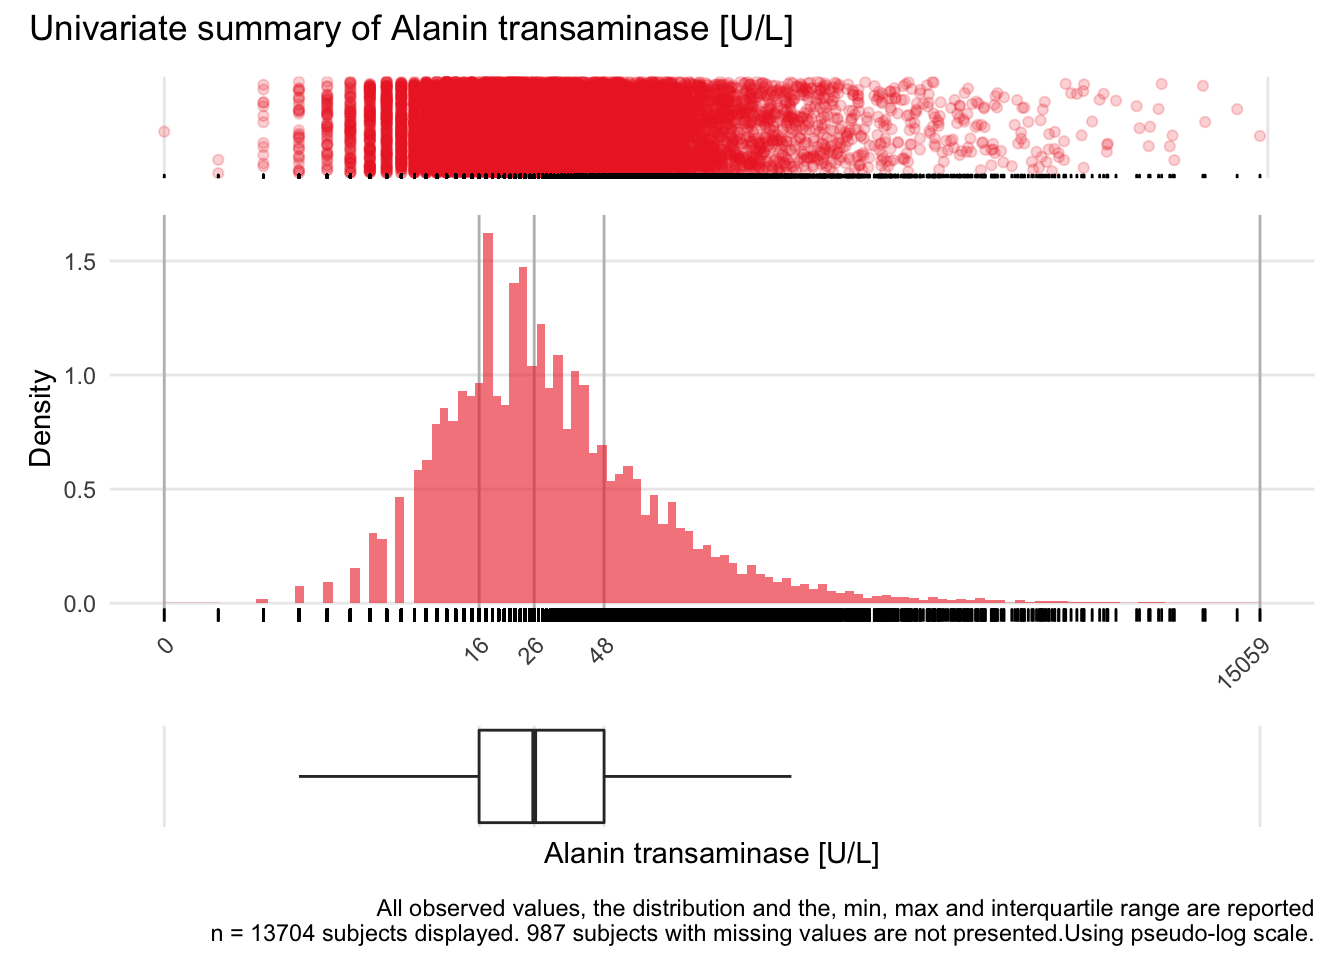
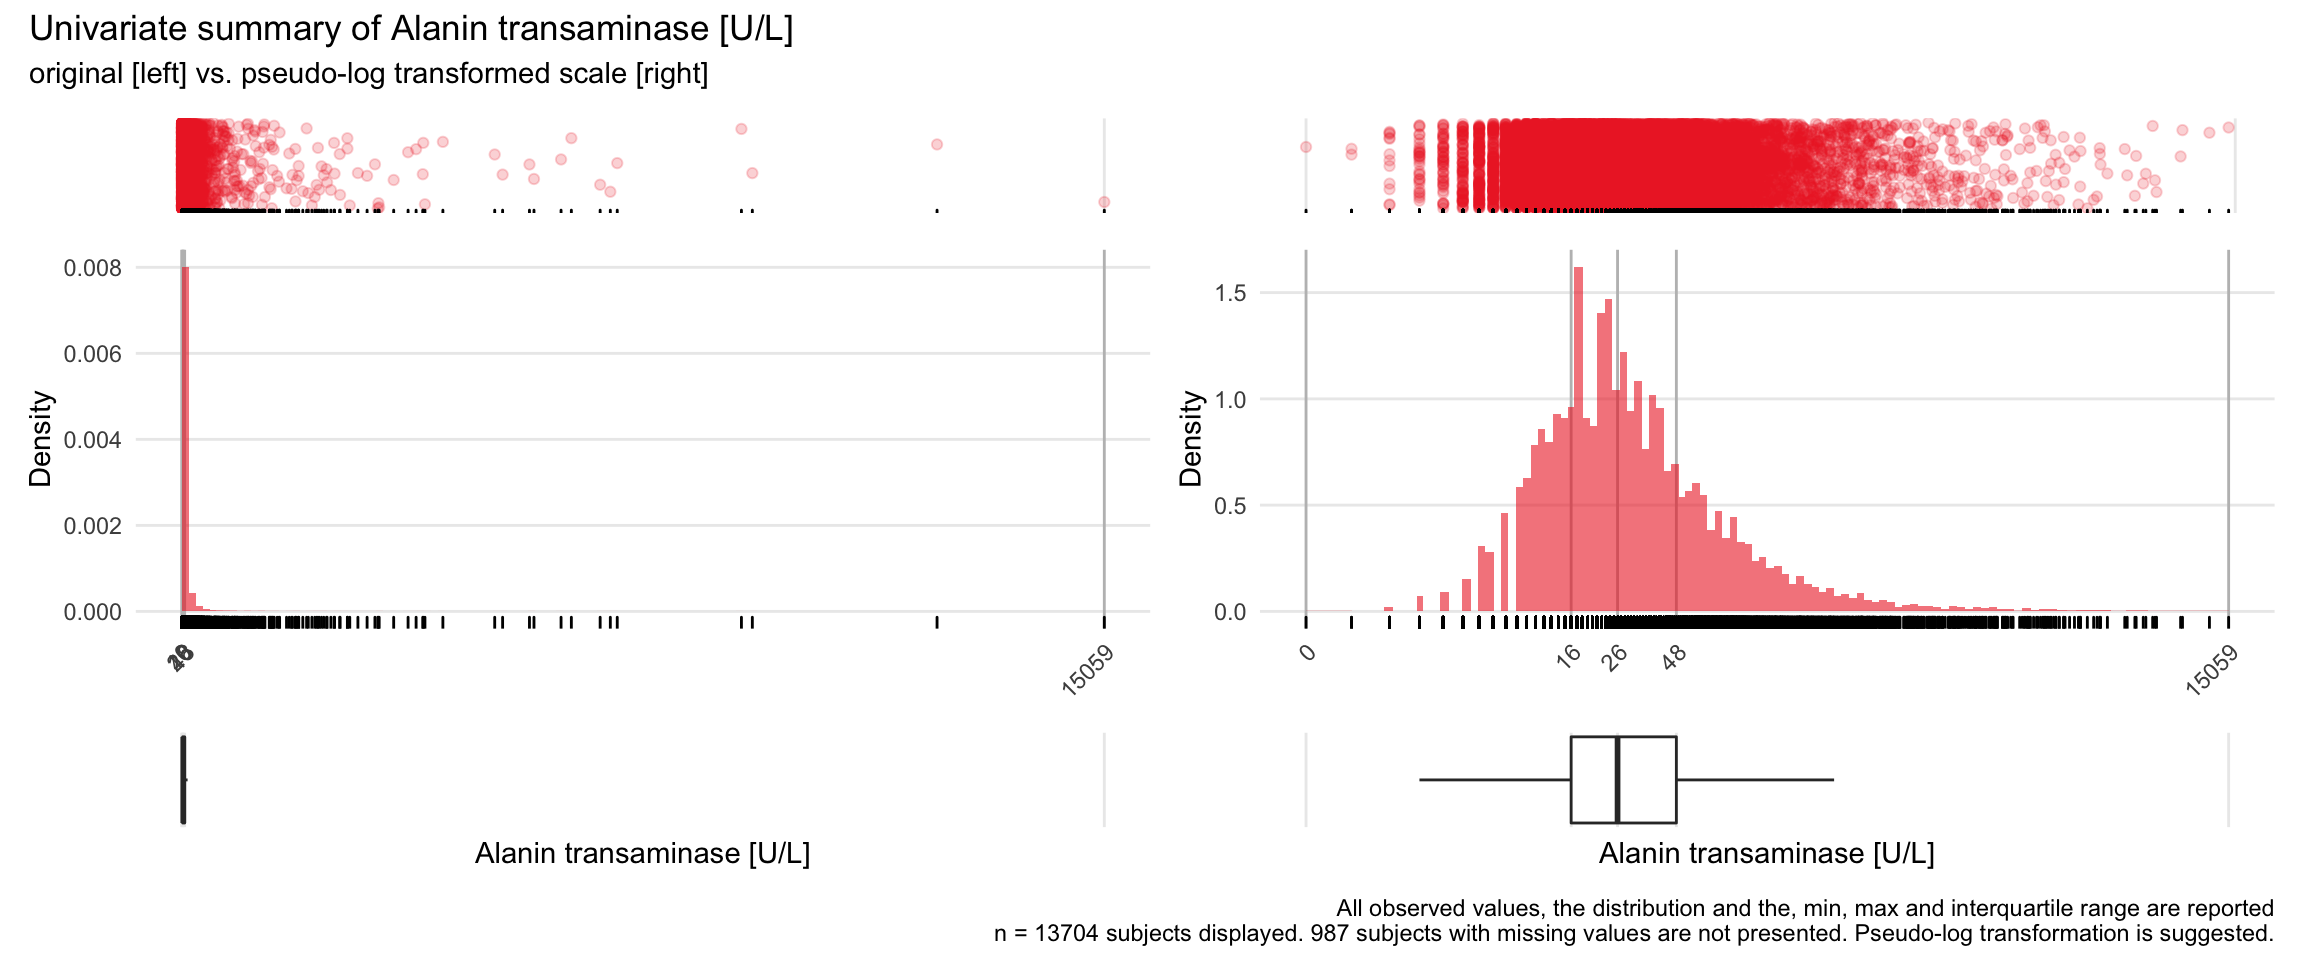
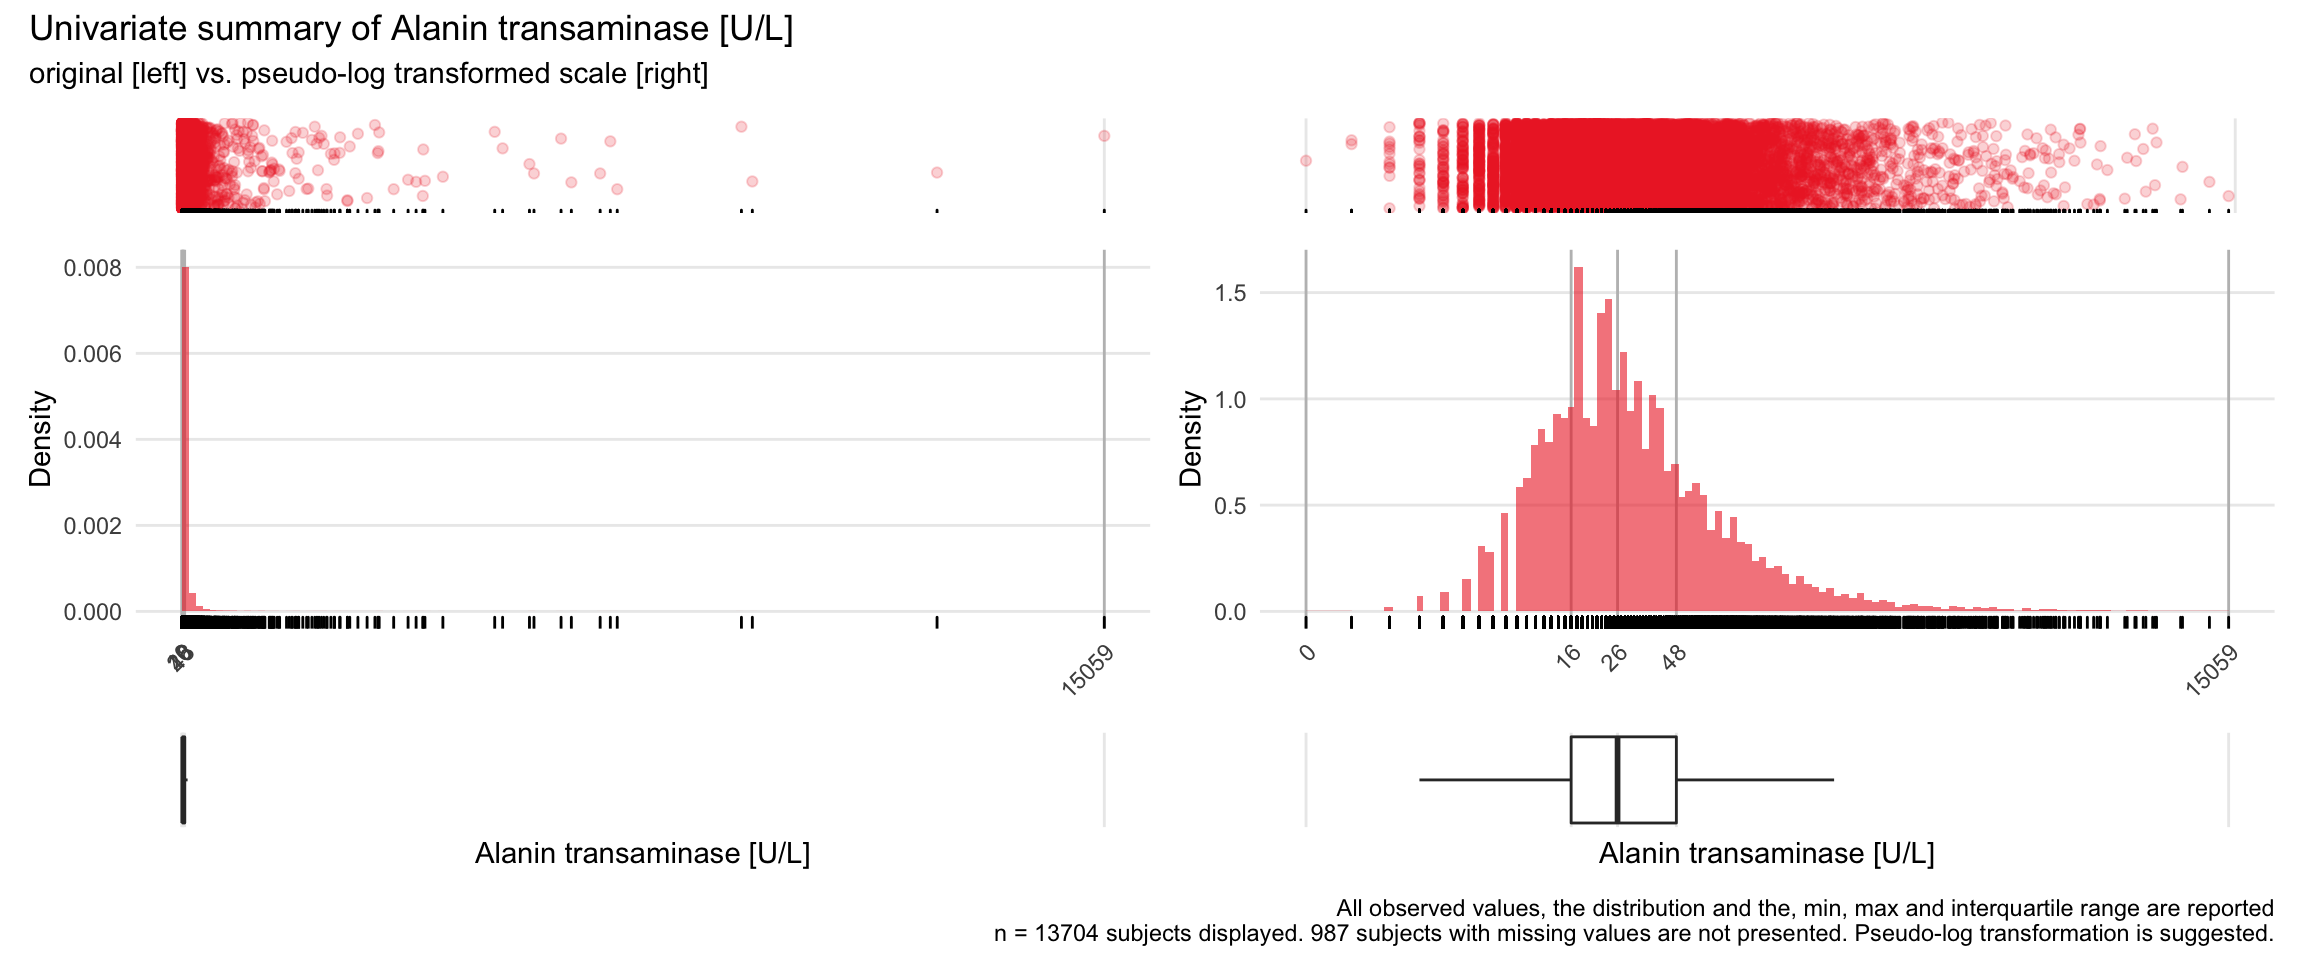
ALAT: Alanin transaminase U/L

| n | missing | distinct | Info | Mean | Gmd | .05 | .10 | .25 | .50 | .75 | .90 | .95 |
|---|---|---|---|---|---|---|---|---|---|---|---|---|
| 13704 | 987 | 578 | 1 | 67.66 | 90.07 | 9 | 11 | 16 | 26 | 48 | 101 | 175 |
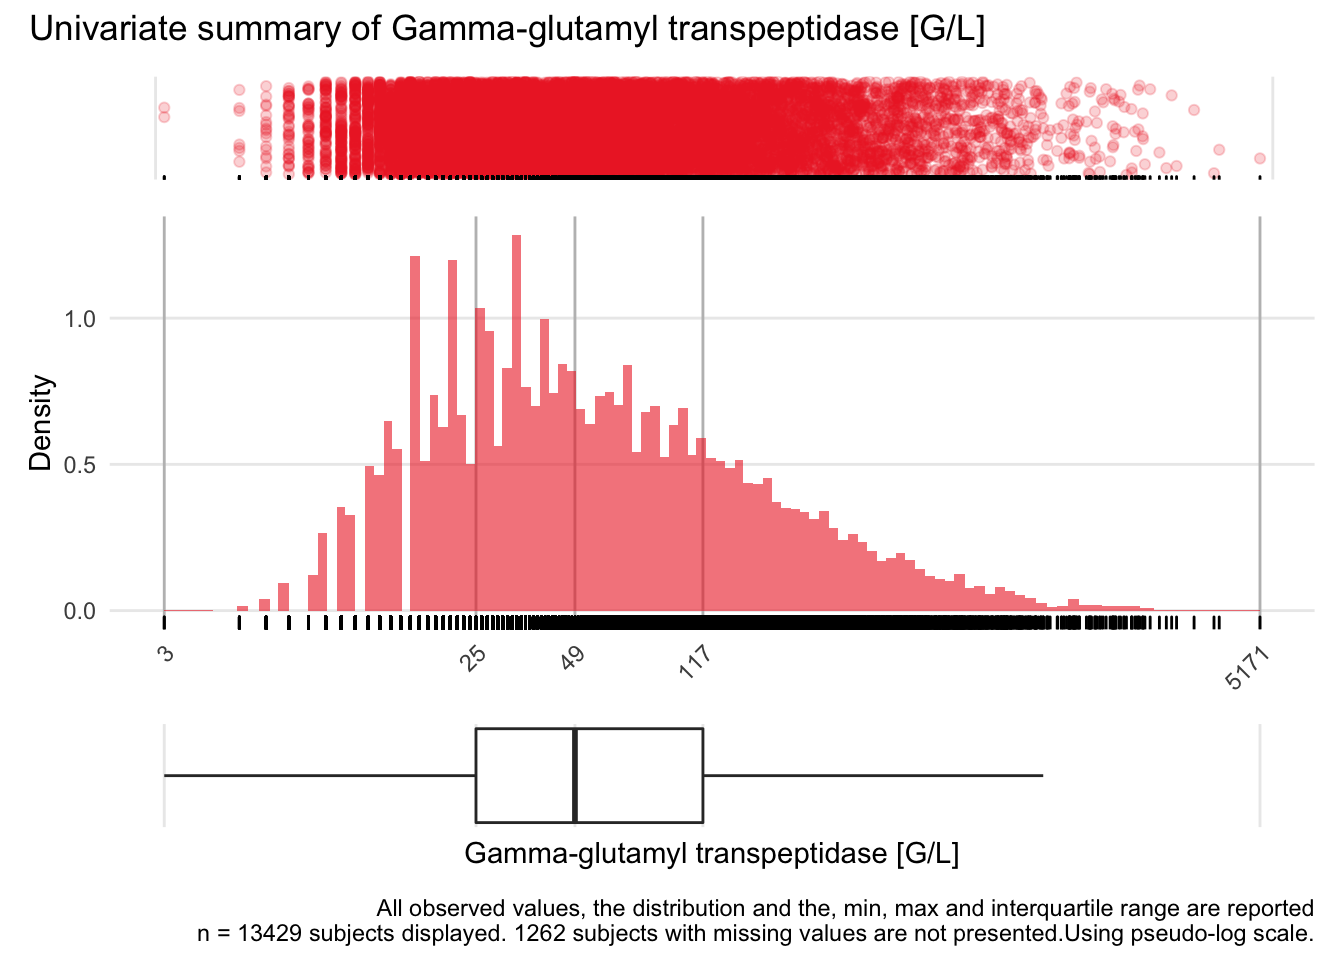
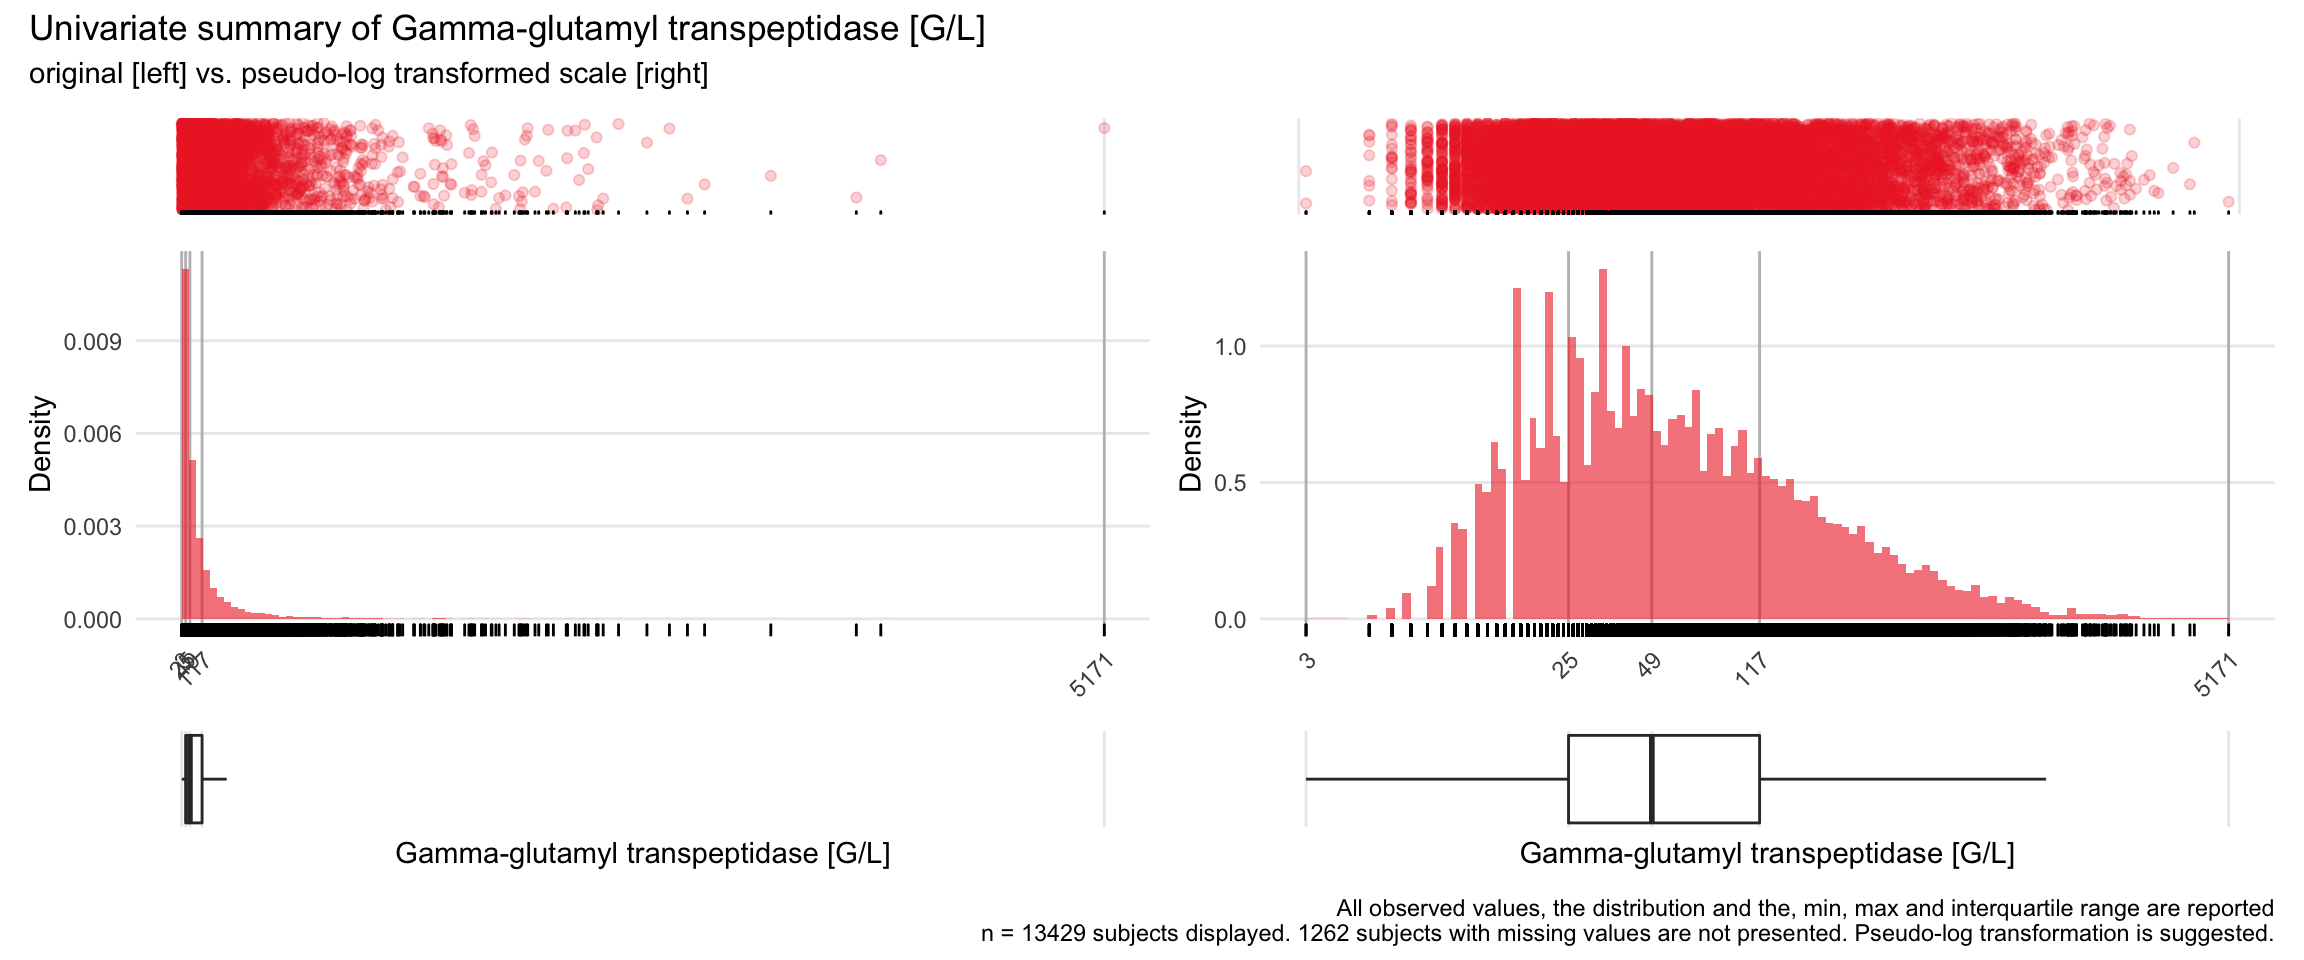
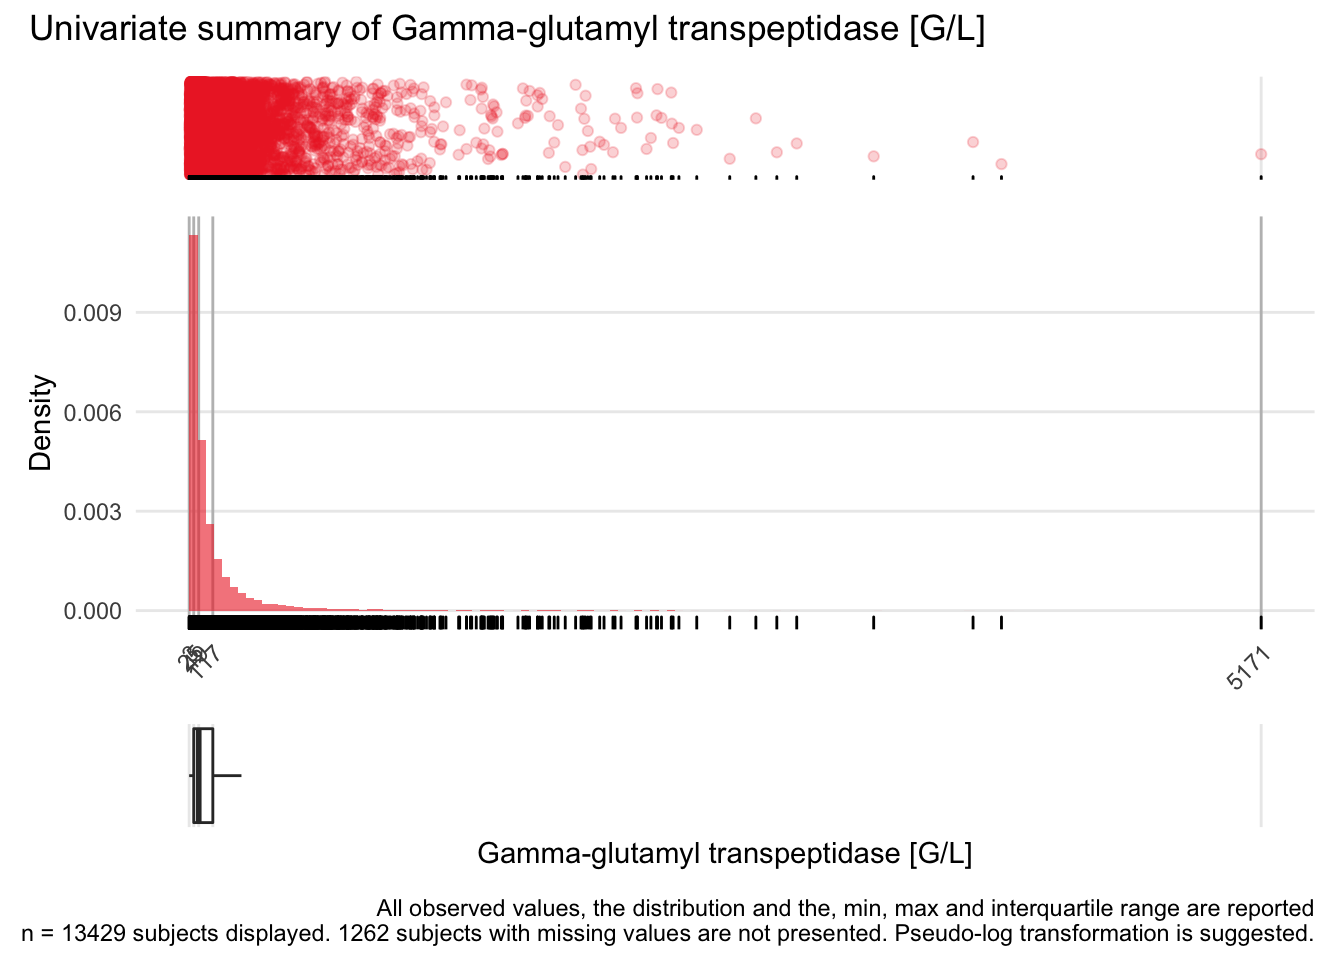
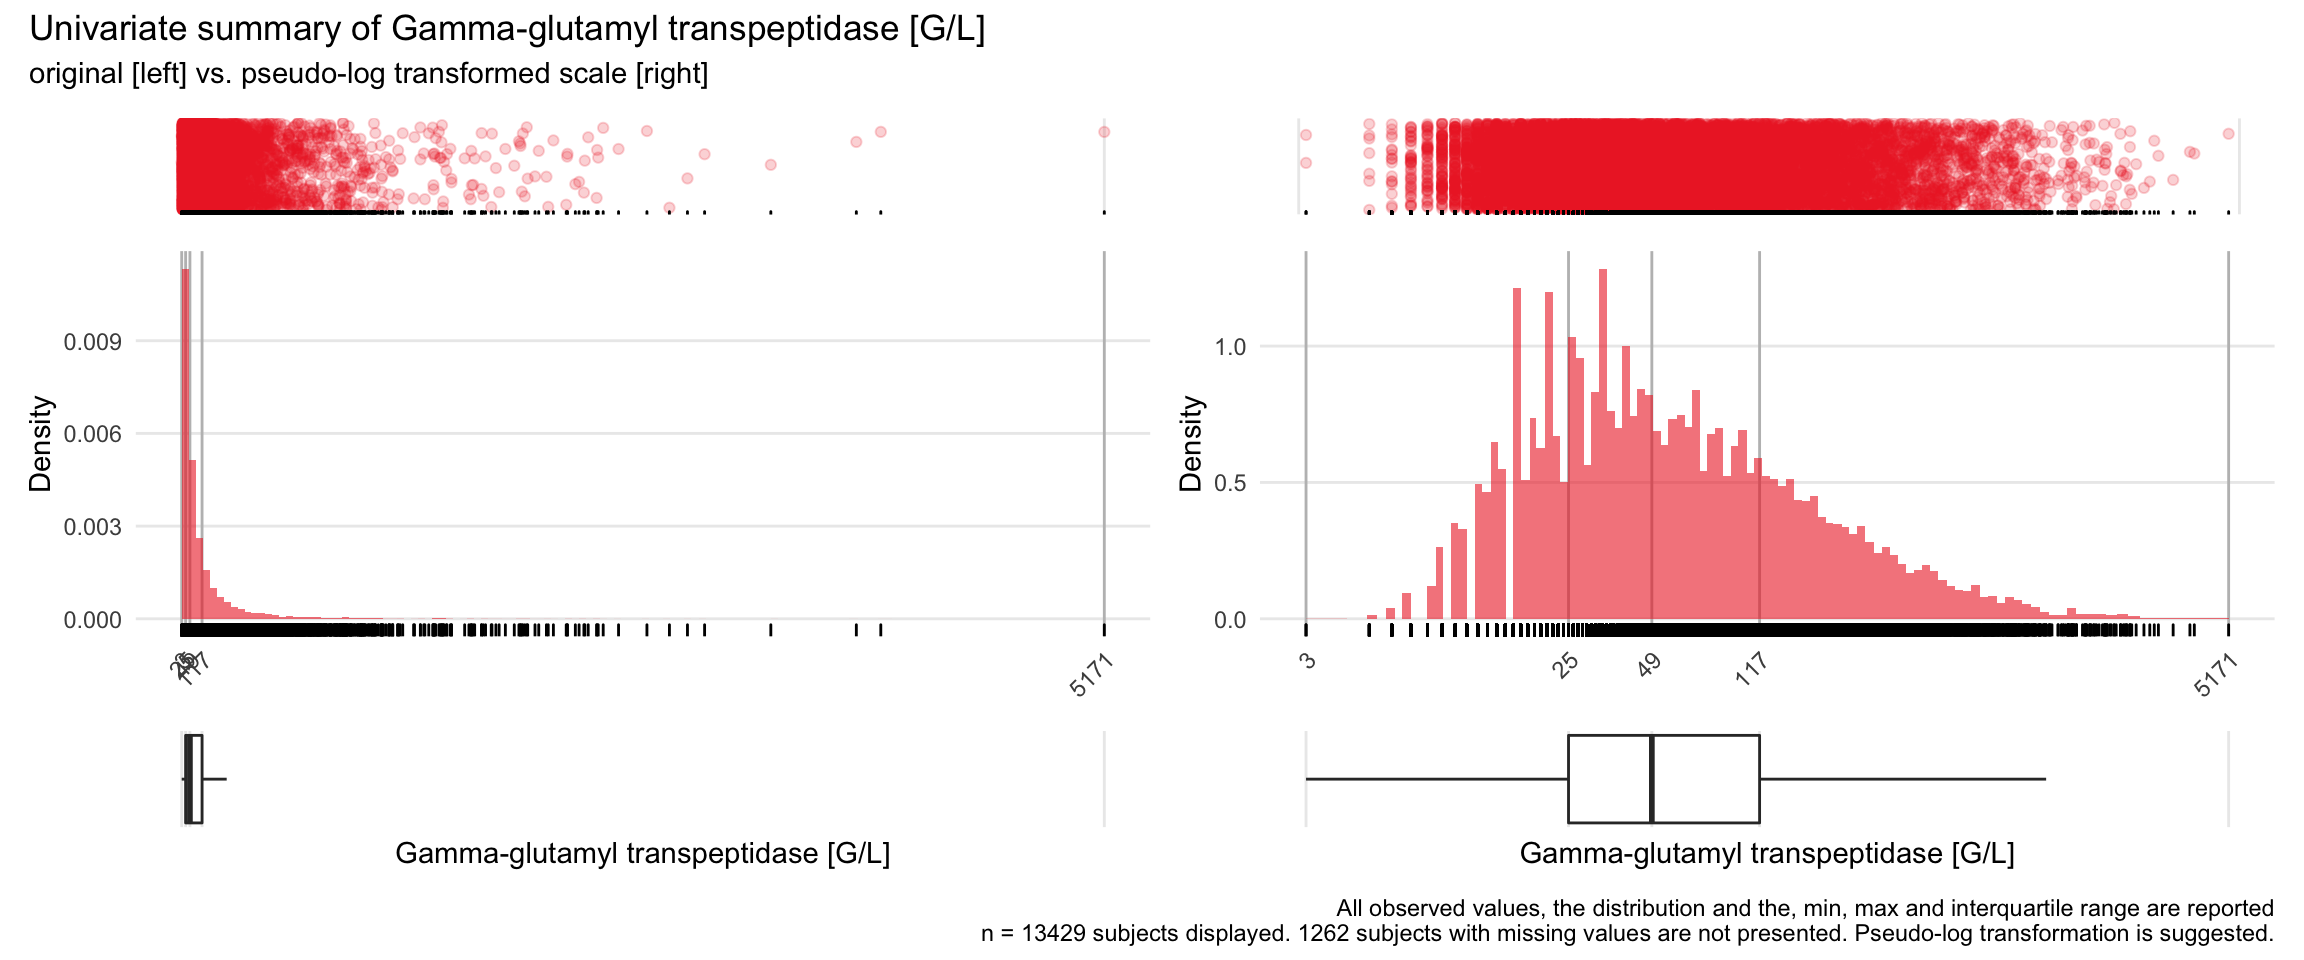
GGT: Γ-glutamyl transpeptidase G/L

| n | missing | distinct | Info | Mean | Gmd | .05 | .10 | .25 | .50 | .75 | .90 | .95 |
|---|---|---|---|---|---|---|---|---|---|---|---|---|
| 13429 | 1262 | 858 | 1 | 115.1 | 141.3 | 13.0 | 16.0 | 25.0 | 49.0 | 117.0 | 262.2 | 429.0 |
8.1.6 Remaining variables
29 Variables 14691 Observations
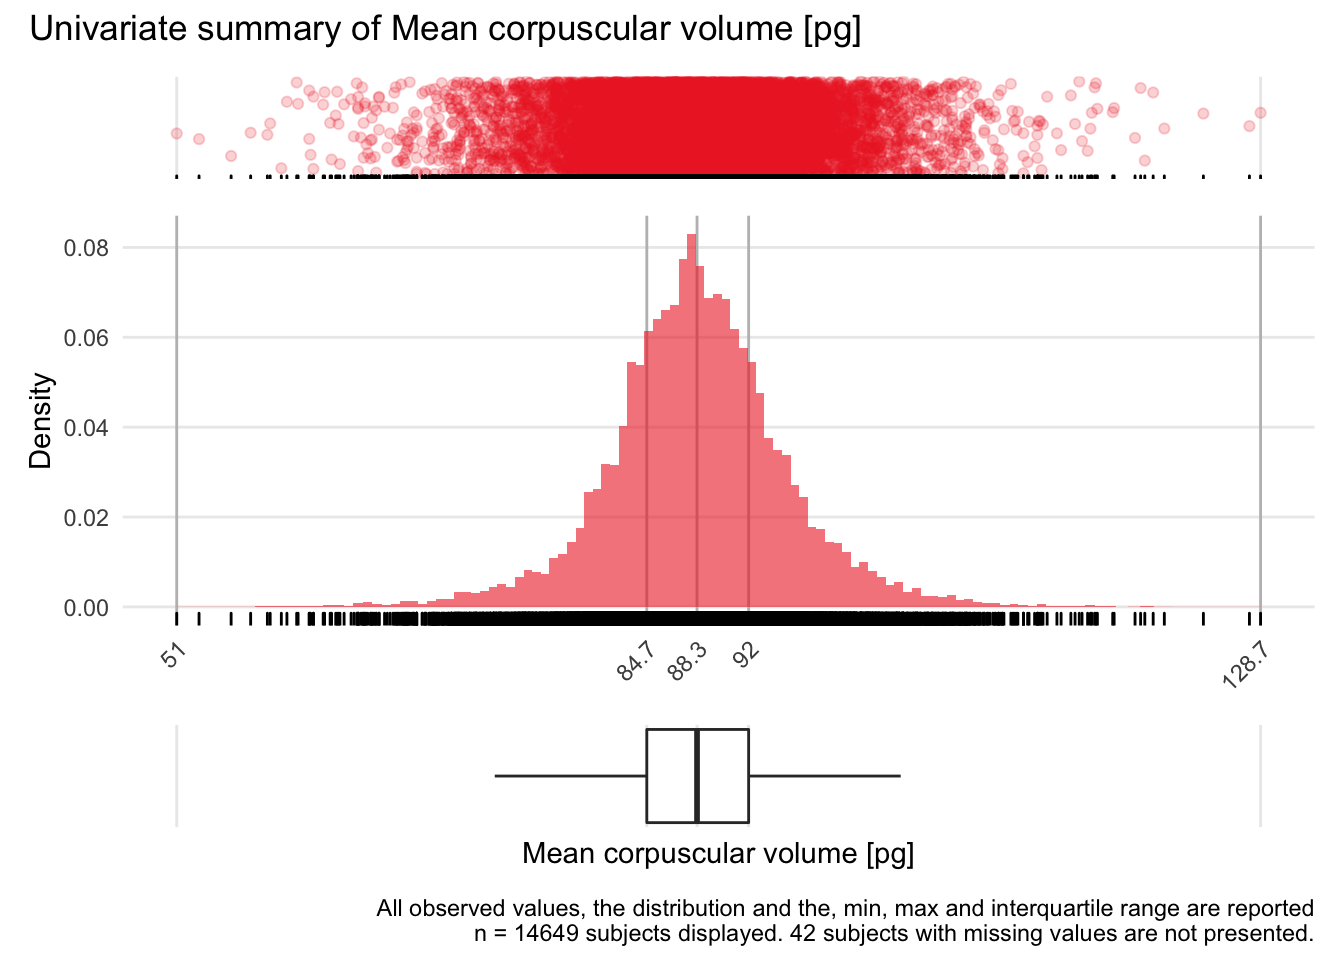
MCV: Mean corpuscular volume pg

| n | missing | distinct | Info | Mean | Gmd | .05 | .10 | .25 | .50 | .75 | .90 | .95 |
|---|---|---|---|---|---|---|---|---|---|---|---|---|
| 14649 | 42 | 506 | 1 | 88.35 | 6.992 | 78.2 | 81.1 | 84.7 | 88.3 | 92.0 | 95.9 | 99.0 |
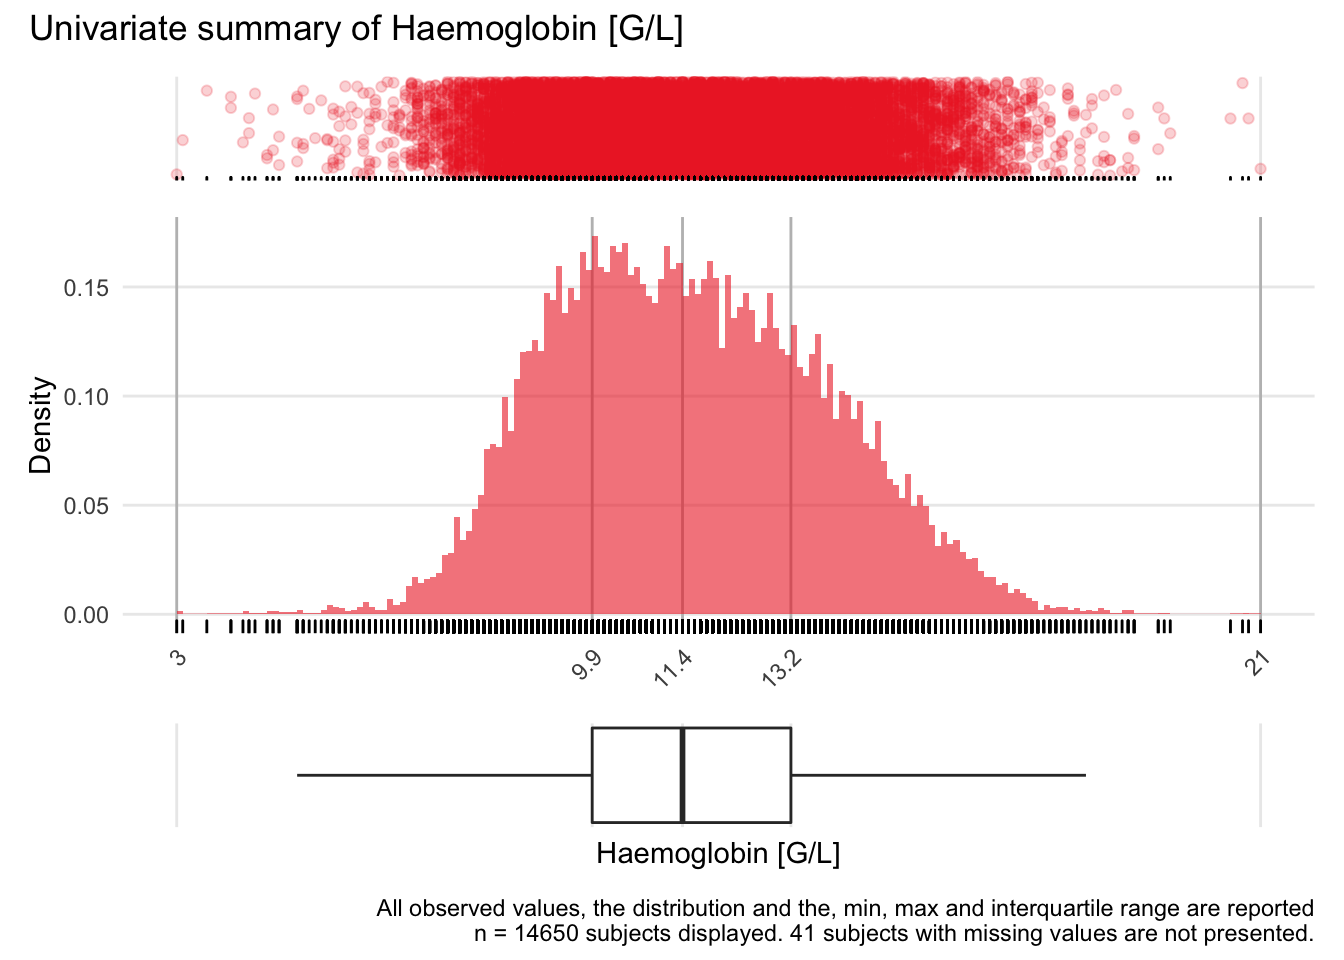
HGB: Haemoglobin G/L

| n | missing | distinct | Info | Mean | Gmd | .05 | .10 | .25 | .50 | .75 | .90 | .95 |
|---|---|---|---|---|---|---|---|---|---|---|---|---|
| 14650 | 41 | 157 | 1 | 11.57 | 2.558 | 8.2 | 8.8 | 9.9 | 11.4 | 13.2 | 14.6 | 15.4 |
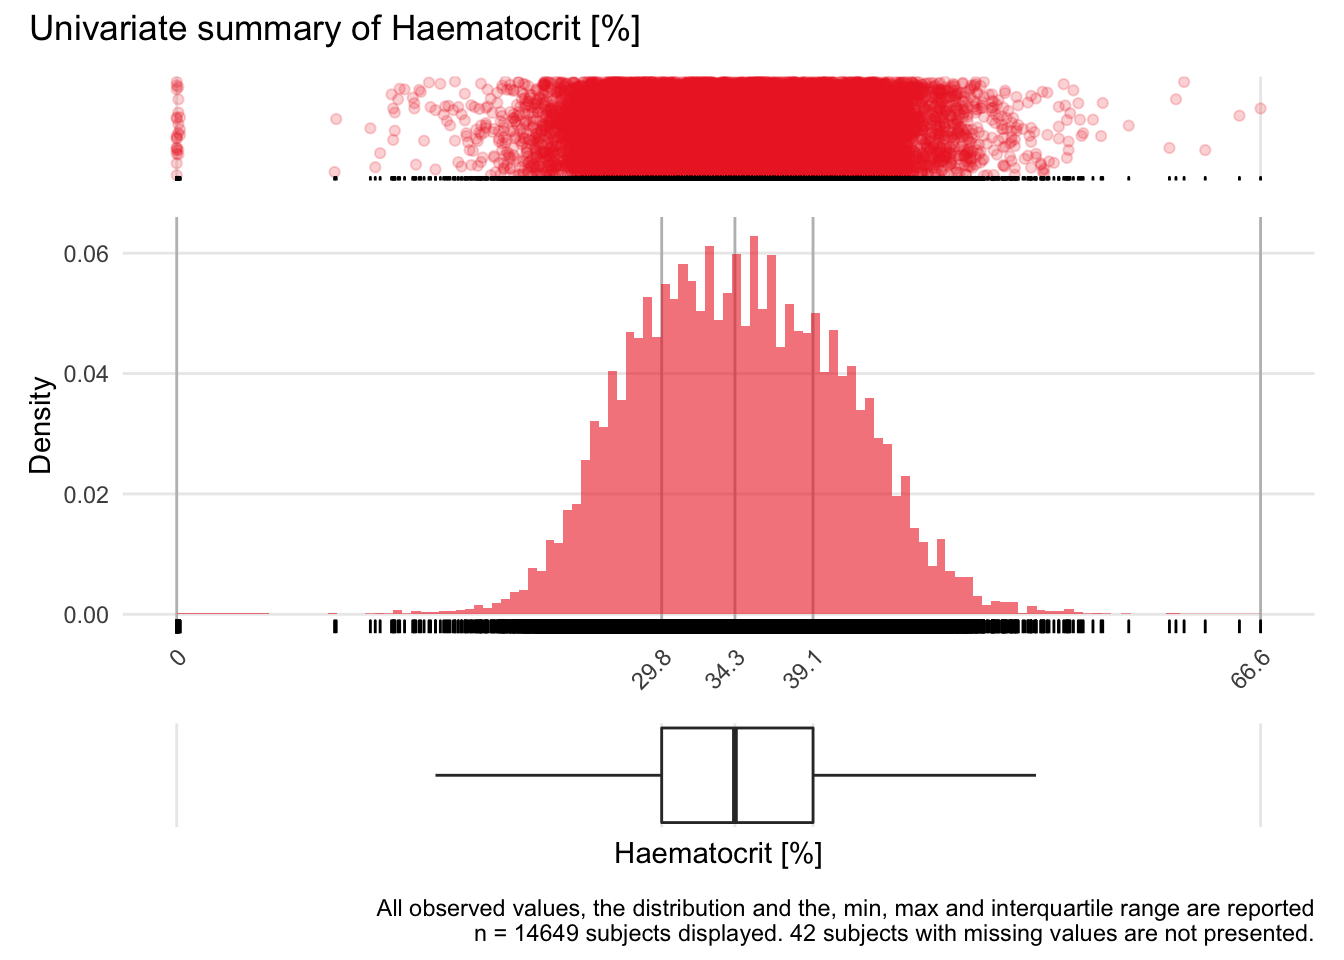
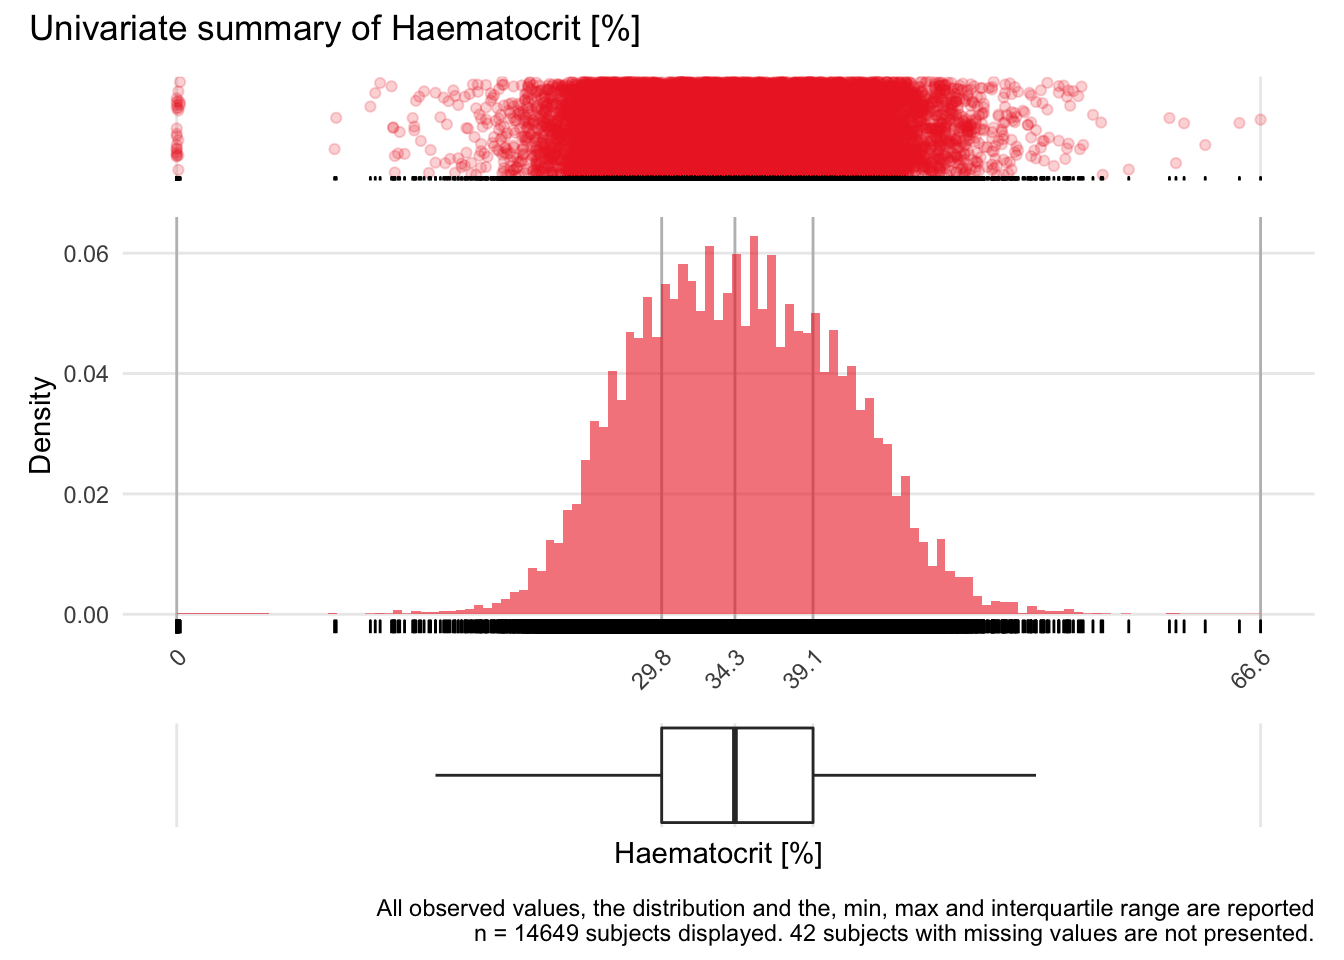
HCT: Haematocrit %

| n | missing | distinct | Info | Mean | Gmd | .05 | .10 | .25 | .50 | .75 | .90 | .95 |
|---|---|---|---|---|---|---|---|---|---|---|---|---|
| 14649 | 42 | 404 | 1 | 34.48 | 7.316 | 24.6 | 26.4 | 29.8 | 34.3 | 39.1 | 42.9 | 44.8 |
MCH: Mean corpuscular hemoglobin fl

| n | missing | distinct | Info | Mean | Gmd | .05 | .10 | .25 | .50 | .75 | .90 | .95 |
|---|---|---|---|---|---|---|---|---|---|---|---|---|
| 14649 | 42 | 232 | 1 | 29.58 | 2.693 | 25.3 | 26.7 | 28.4 | 29.7 | 31.0 | 32.4 | 33.4 |
MCHC: Mean corpuscular hemoglobin concentration g/dl

| n | missing | distinct | Info | Mean | Gmd | .05 | .10 | .25 | .50 | .75 | .90 | .95 |
|---|---|---|---|---|---|---|---|---|---|---|---|---|
| 14649 | 42 | 124 | 0.999 | 33.47 | 1.546 | 31.1 | 31.7 | 32.6 | 33.5 | 34.4 | 35.2 | 35.6 |
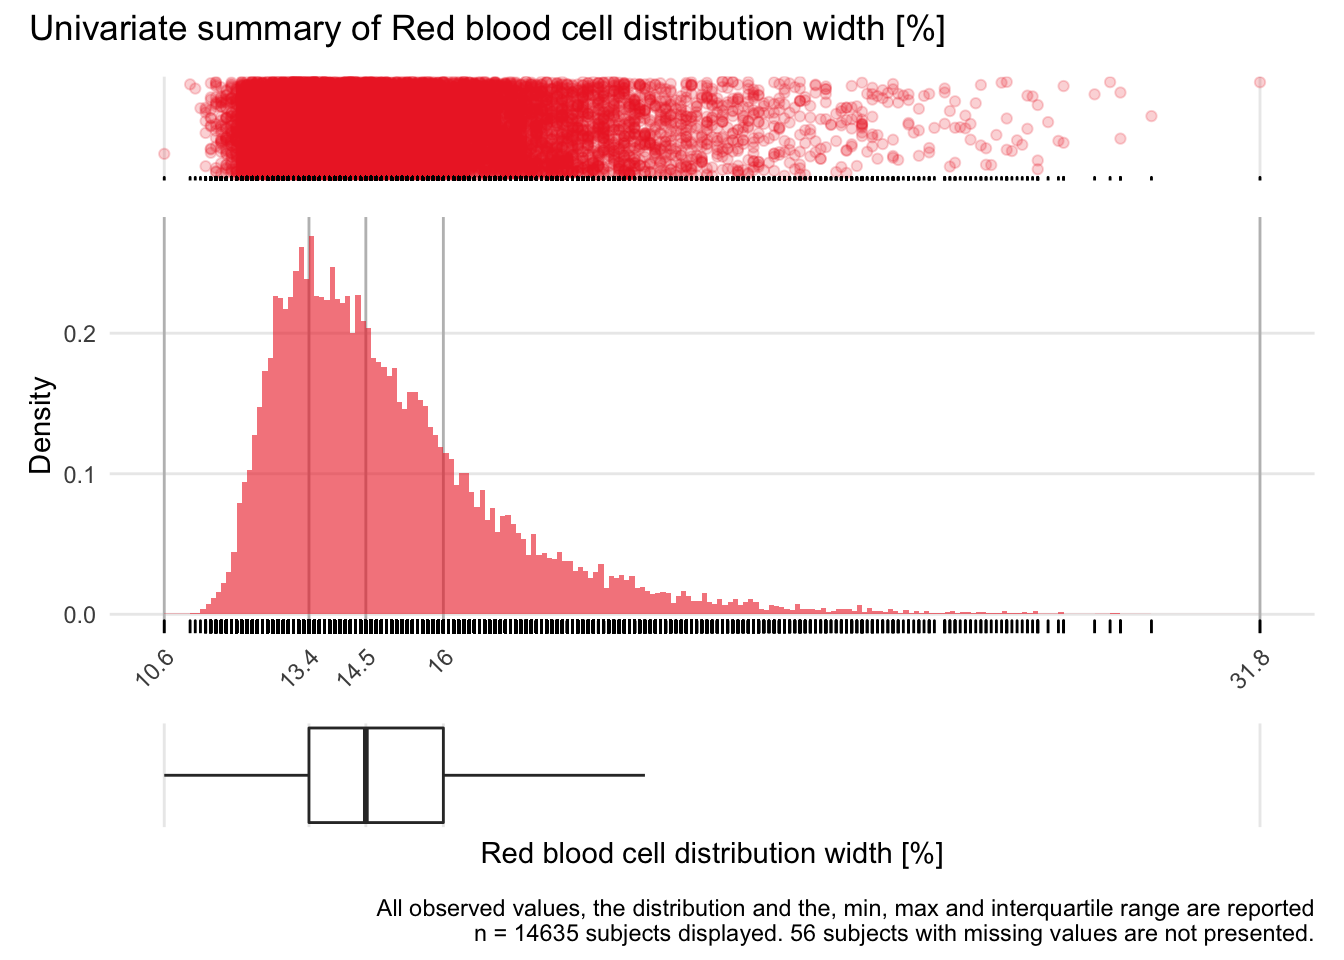
RDW: Red blood cell distribution width %

| n | missing | distinct | Info | Mean | Gmd | .05 | .10 | .25 | .50 | .75 | .90 | .95 |
|---|---|---|---|---|---|---|---|---|---|---|---|---|
| 14635 | 56 | 173 | 1 | 15 | 2.385 | 12.4 | 12.7 | 13.4 | 14.5 | 16.0 | 18.0 | 19.5 |
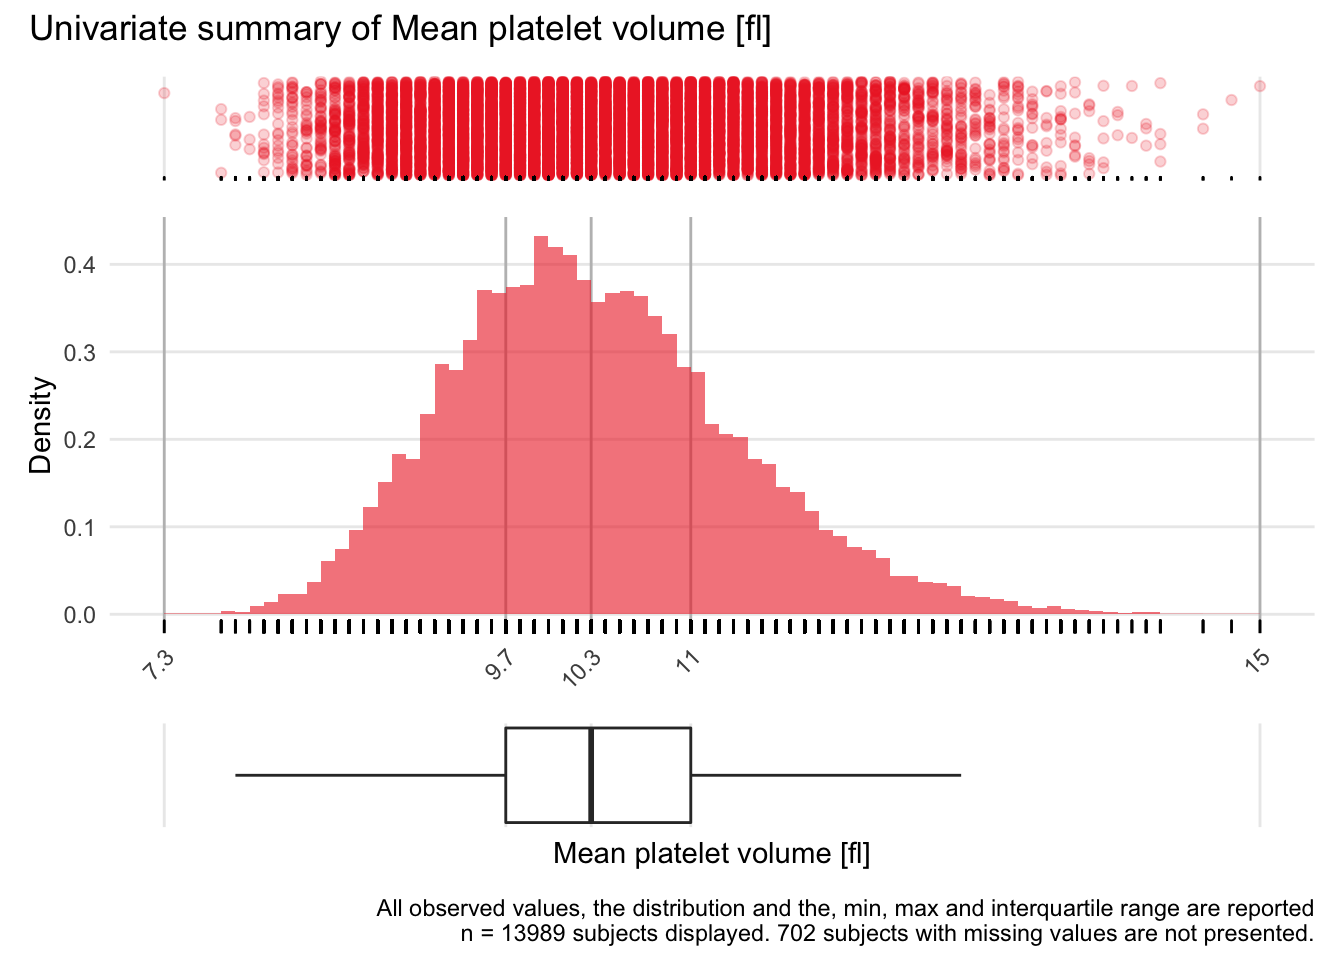
MPV: Mean platelet volume fl

| n | missing | distinct | Info | Mean | Gmd | .05 | .10 | .25 | .50 | .75 | .90 | .95 |
|---|---|---|---|---|---|---|---|---|---|---|---|---|
| 13989 | 702 | 71 | 0.999 | 10.38 | 1.132 | 8.9 | 9.2 | 9.7 | 10.3 | 11.0 | 11.7 | 12.2 |
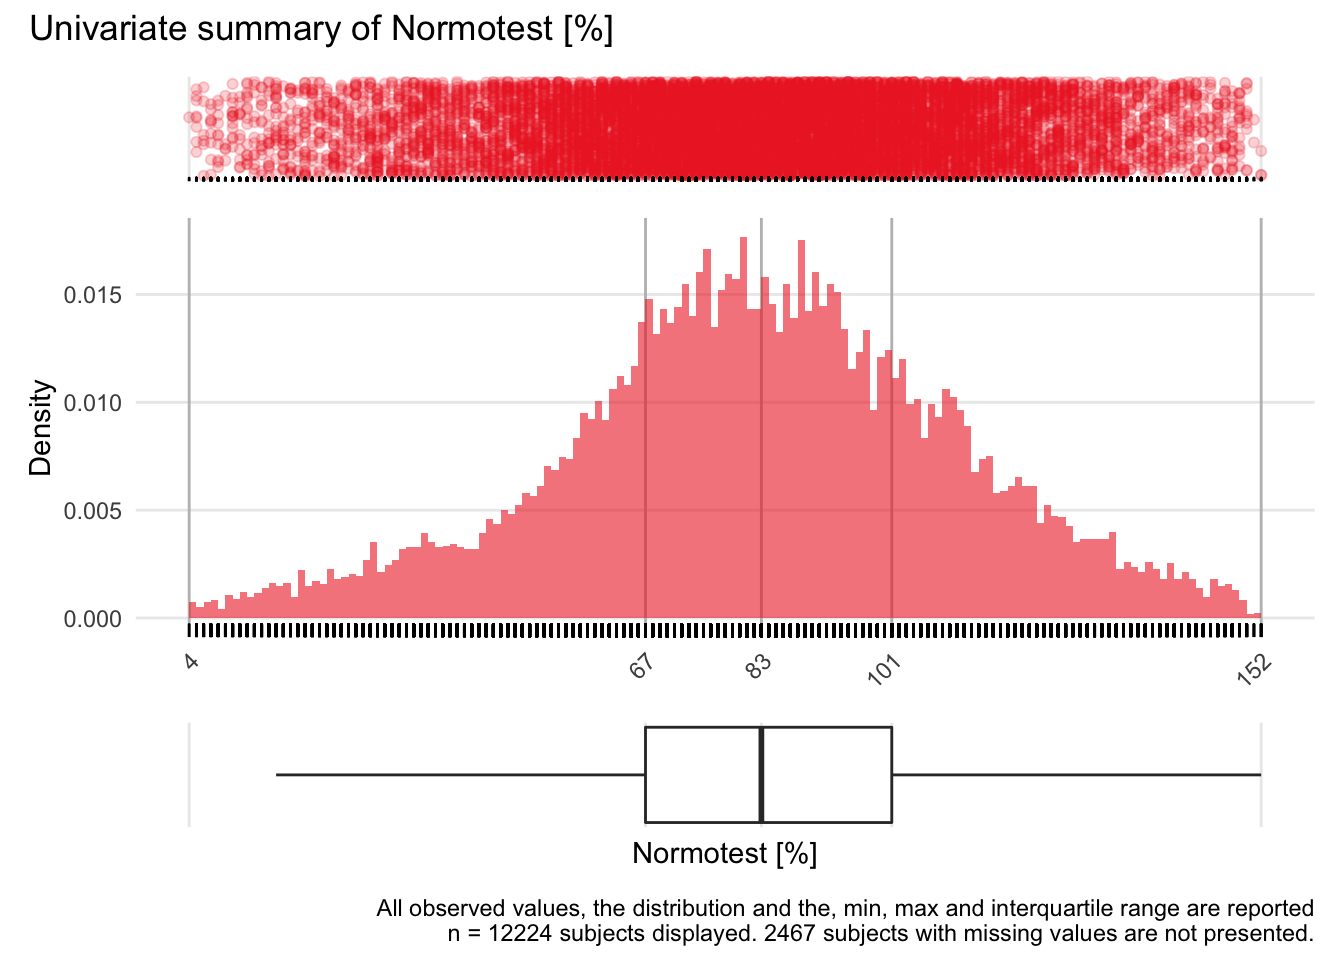
NT: Normotest %

| n | missing | distinct | Info | Mean | Gmd | .05 | .10 | .25 | .50 | .75 | .90 | .95 |
|---|---|---|---|---|---|---|---|---|---|---|---|---|
| 12224 | 2467 | 149 | 1 | 83.22 | 30.56 | 35 | 48 | 67 | 83 | 101 | 118 | 128 |
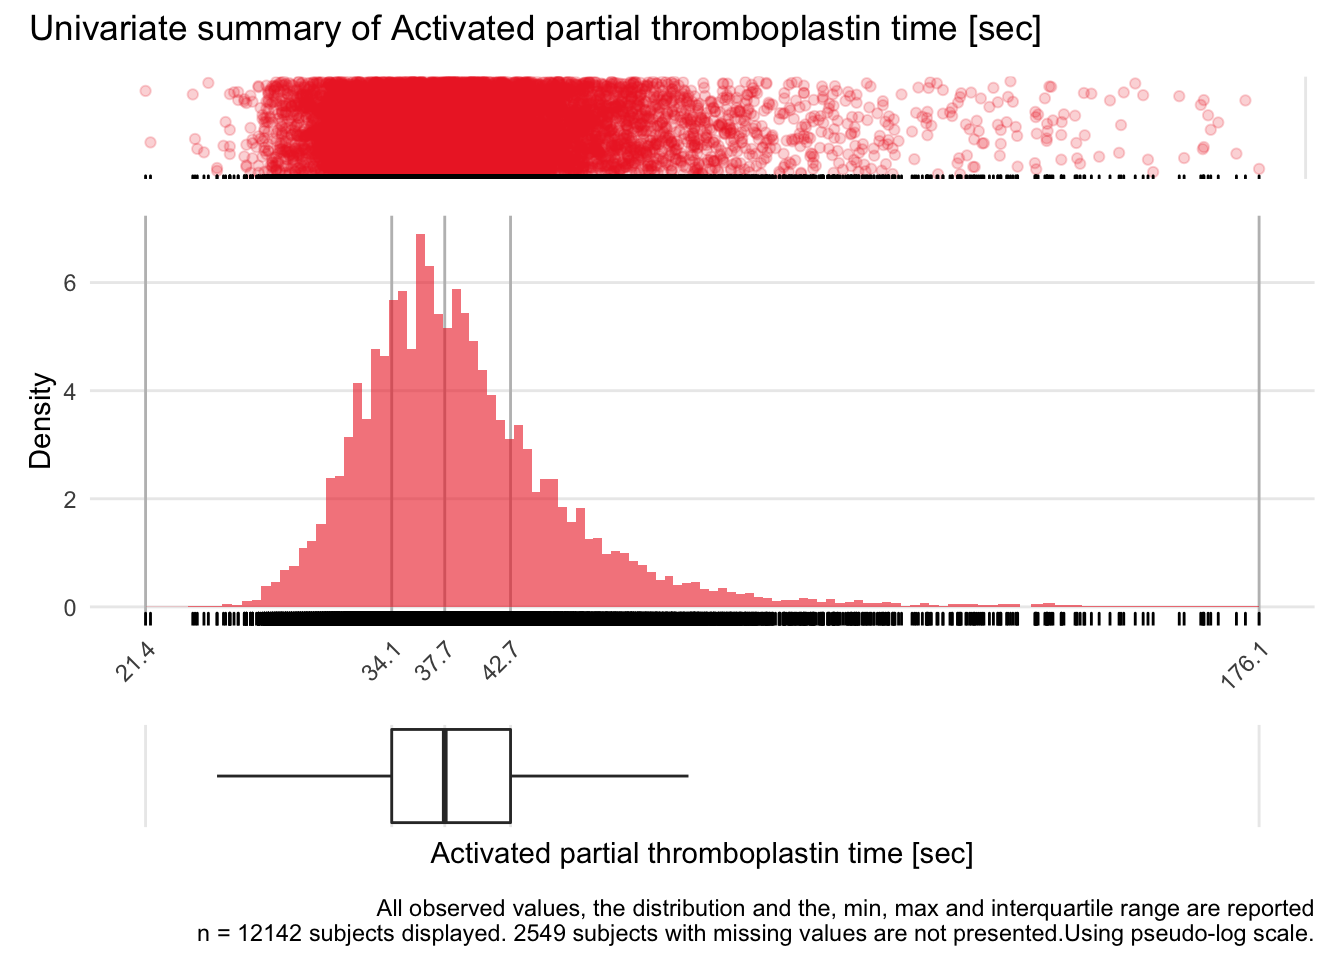
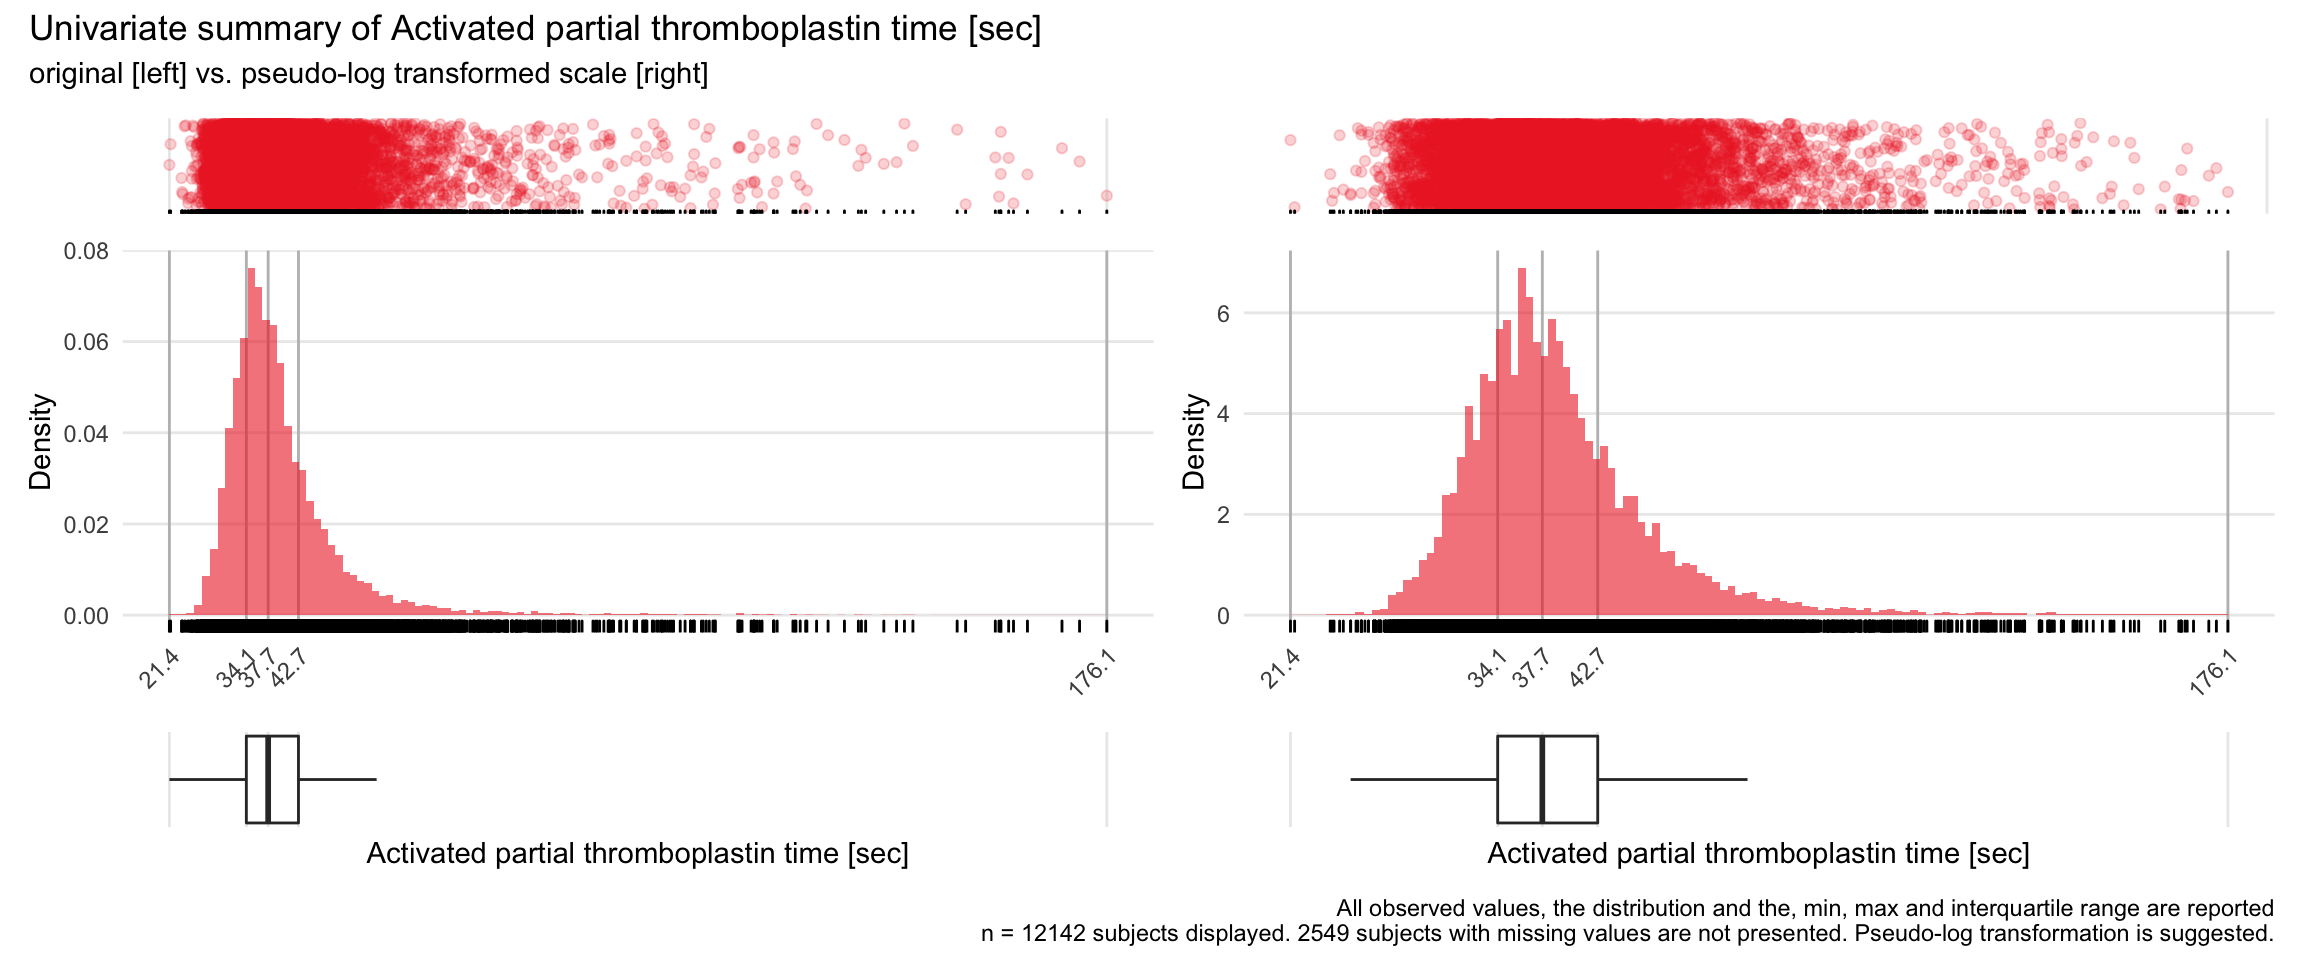
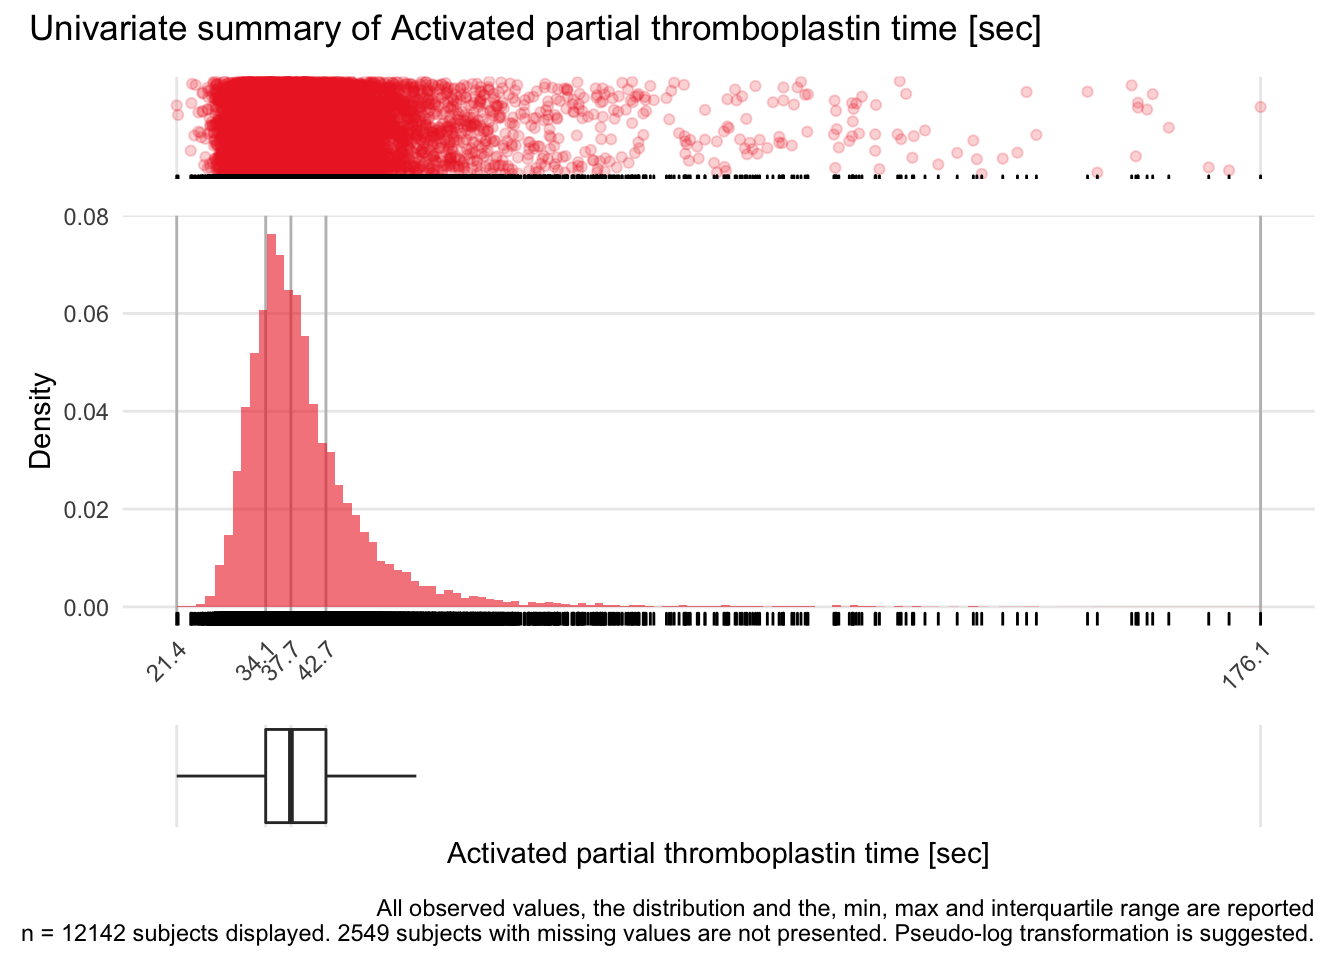
APTT: Activated partial thromboplastin time sec

| n | missing | distinct | Info | Mean | Gmd | .05 | .10 | .25 | .50 | .75 | .90 | .95 |
|---|---|---|---|---|---|---|---|---|---|---|---|---|
| 12142 | 2549 | 631 | 1 | 40.06 | 9.533 | 30.1 | 31.4 | 34.1 | 37.7 | 42.7 | 49.9 | 56.6 |
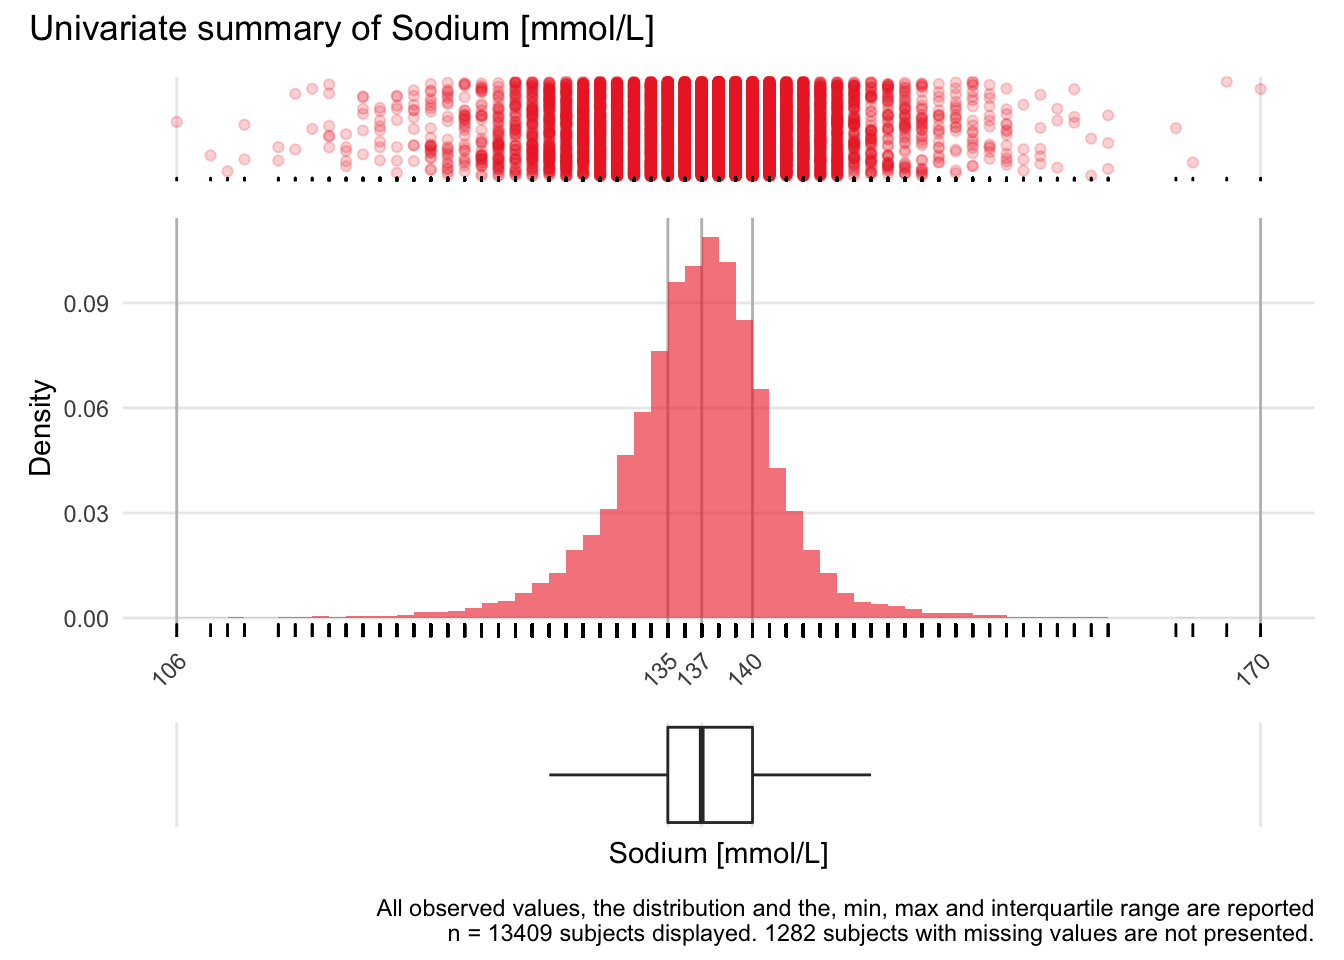
SODIUM: Sodium mmol/L

| n | missing | distinct | Info | Mean | Gmd | .05 | .10 | .25 | .50 | .75 | .90 | .95 |
|---|---|---|---|---|---|---|---|---|---|---|---|---|
| 13409 | 1282 | 58 | 0.994 | 137.2 | 5.034 | 129 | 132 | 135 | 137 | 140 | 142 | 144 |
CA: Calcium mmol/L

| n | missing | distinct | Info | Mean | Gmd | .05 | .10 | .25 | .50 | .75 | .90 | .95 |
|---|---|---|---|---|---|---|---|---|---|---|---|---|
| 13415 | 1276 | 185 | 1 | 2.214 | 0.2213 | 1.89 | 1.96 | 2.09 | 2.22 | 2.35 | 2.45 | 2.51 |
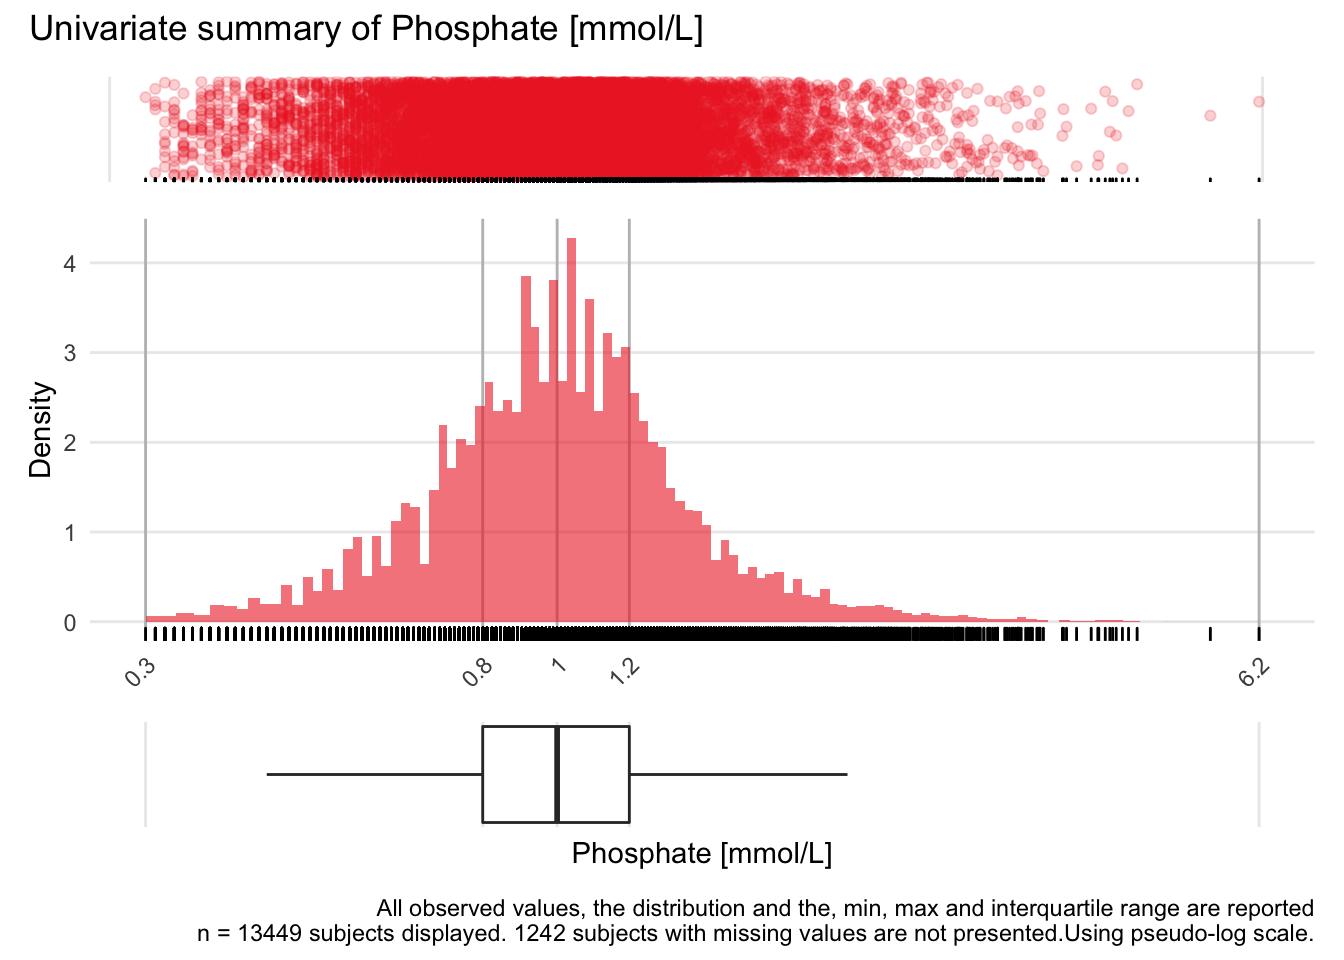
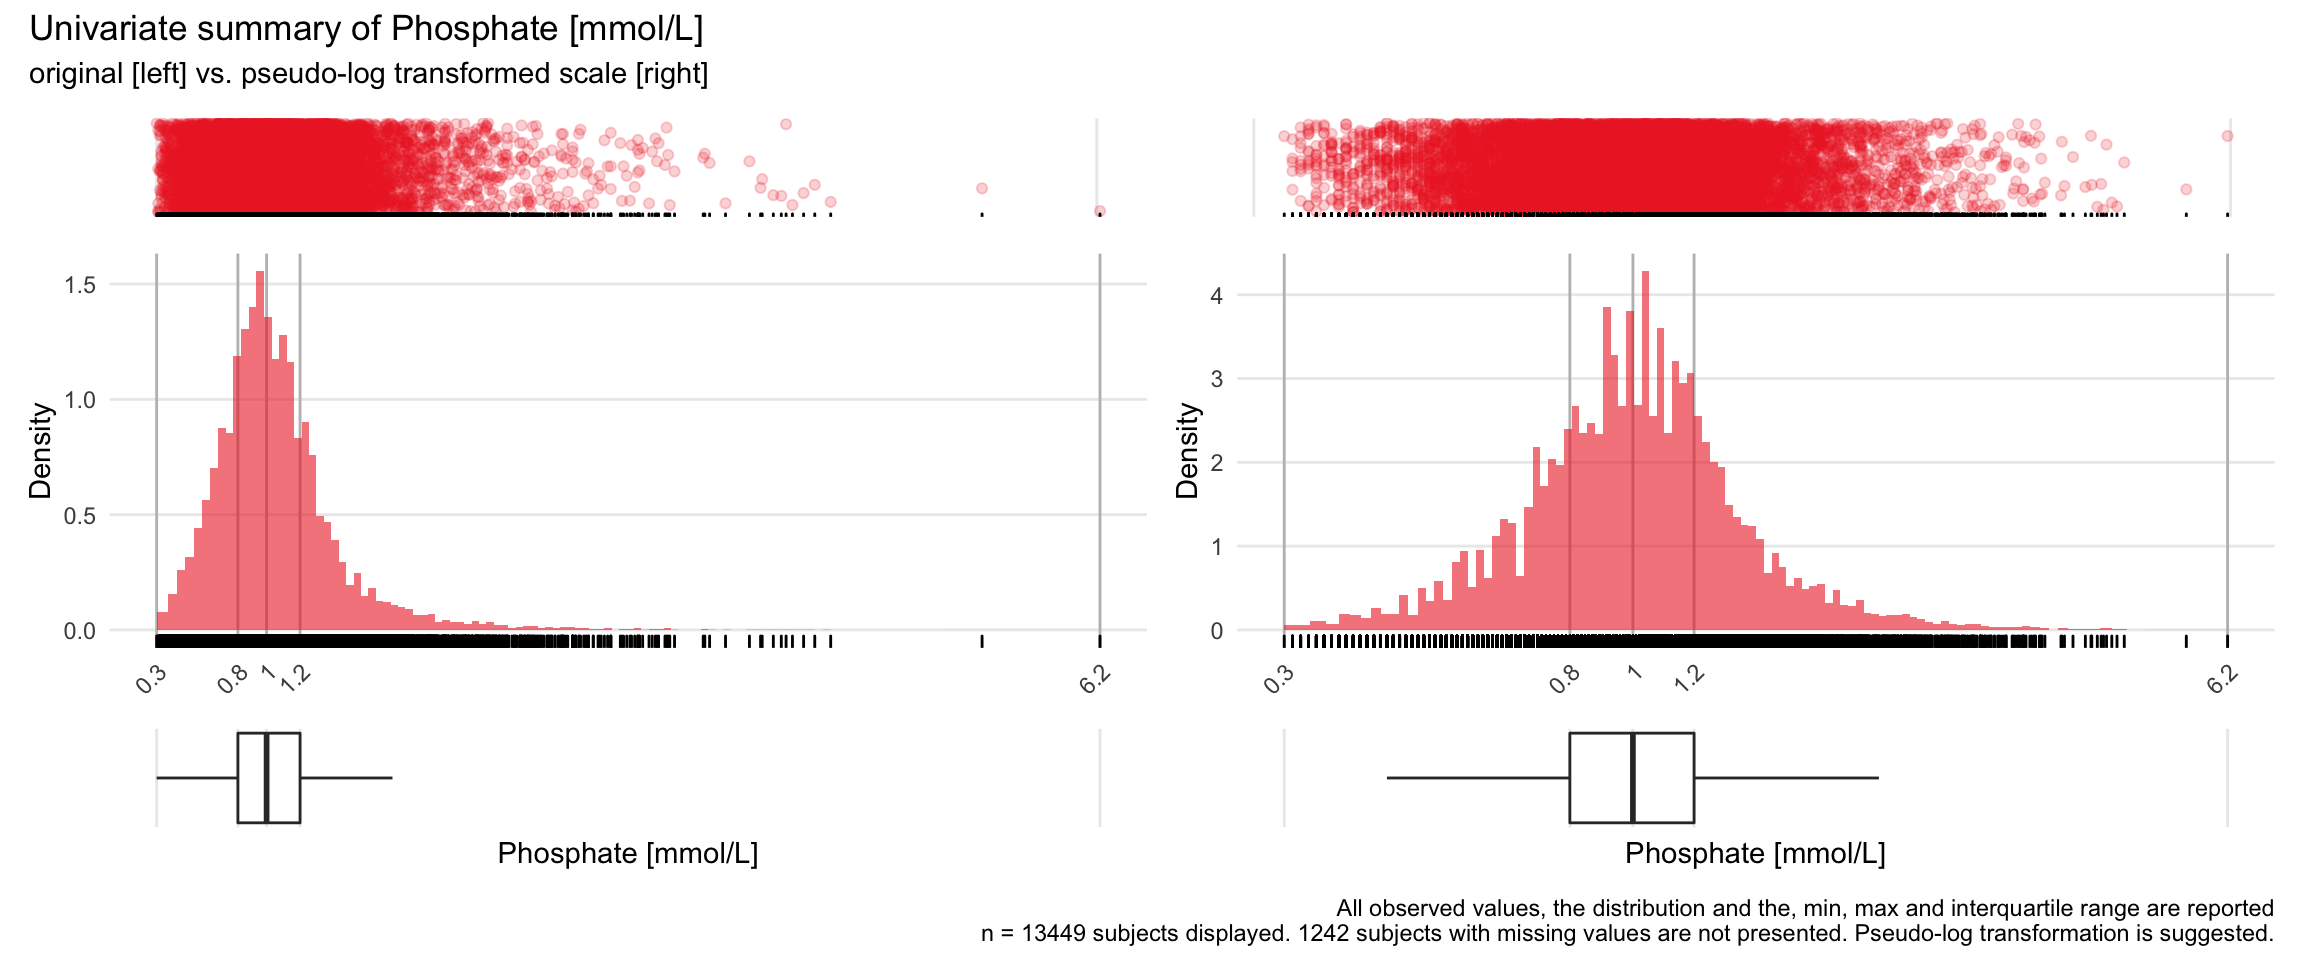
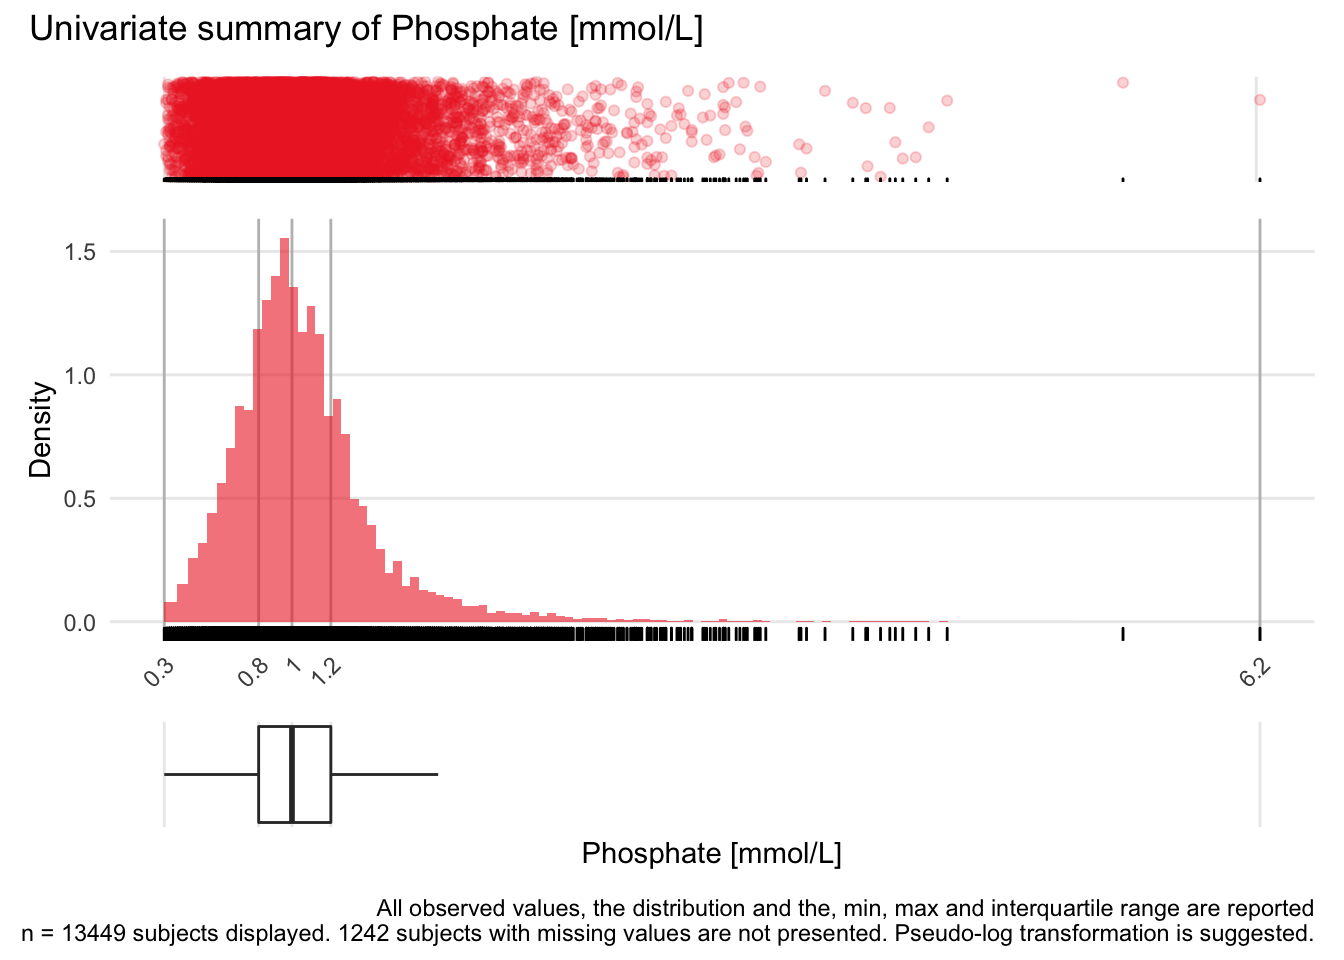
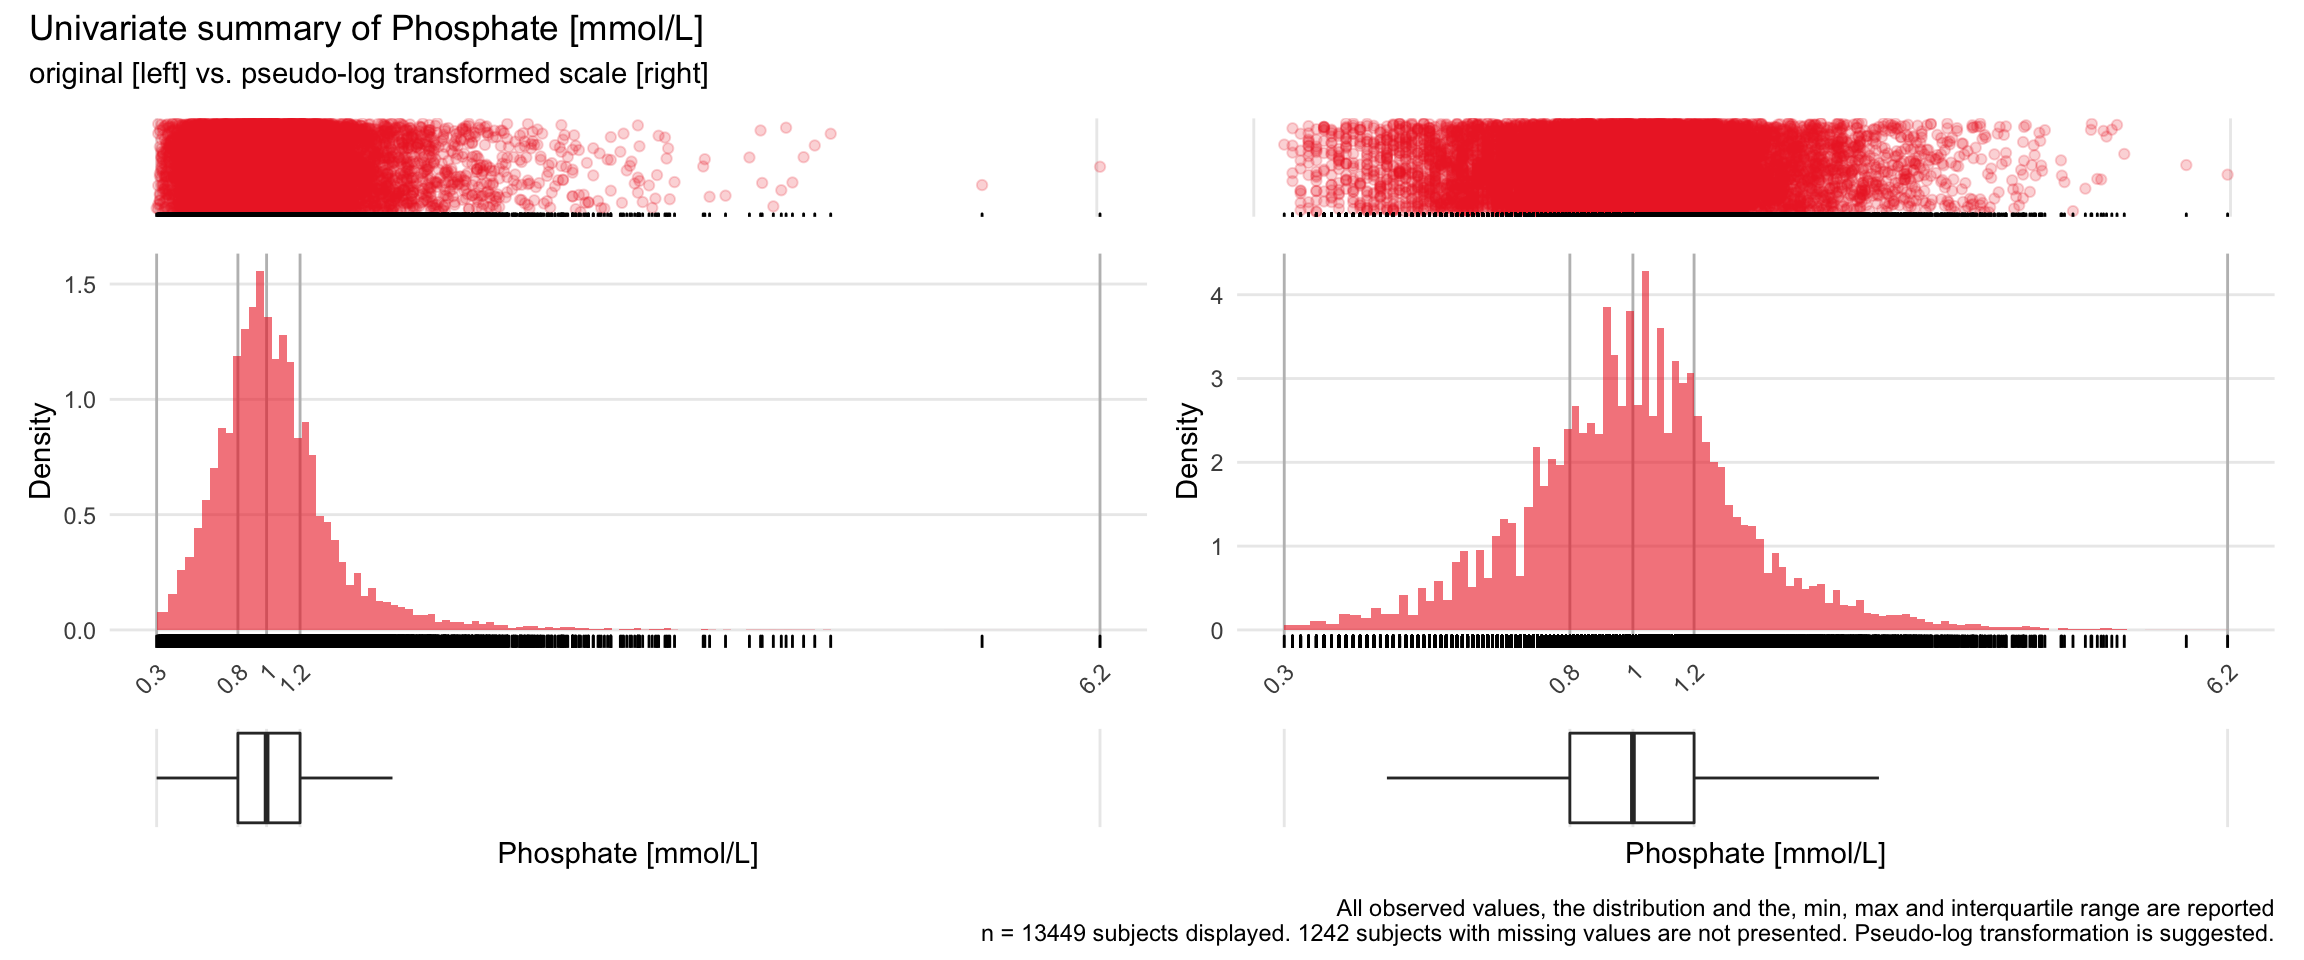
PHOS: Phosphate mmol/L

| n | missing | distinct | Info | Mean | Gmd | .05 | .10 | .25 | .50 | .75 | .90 | .95 |
|---|---|---|---|---|---|---|---|---|---|---|---|---|
| 13449 | 1242 | 306 | 1 | 1.048 | 0.3993 | 0.55 | 0.64 | 0.81 | 0.99 | 1.20 | 1.47 | 1.74 |
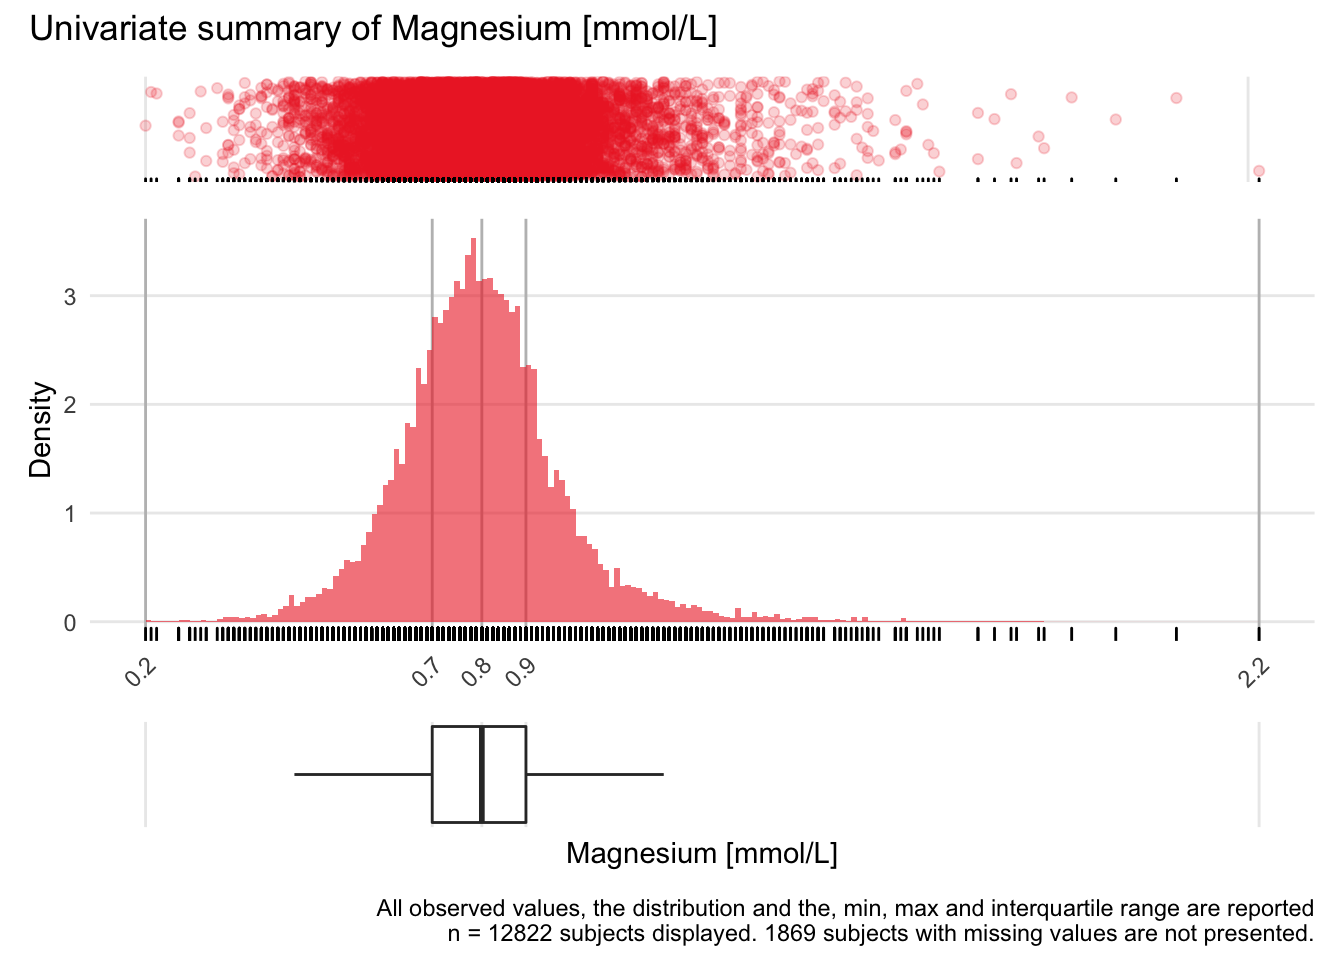
MG: Magnesium mmol/L

| n | missing | distinct | Info | Mean | Gmd | .05 | .10 | .25 | .50 | .75 | .90 | .95 |
|---|---|---|---|---|---|---|---|---|---|---|---|---|
| 12822 | 1869 | 146 | 0.999 | 0.8136 | 0.1609 | 0.59 | 0.64 | 0.72 | 0.81 | 0.89 | 0.98 | 1.06 |
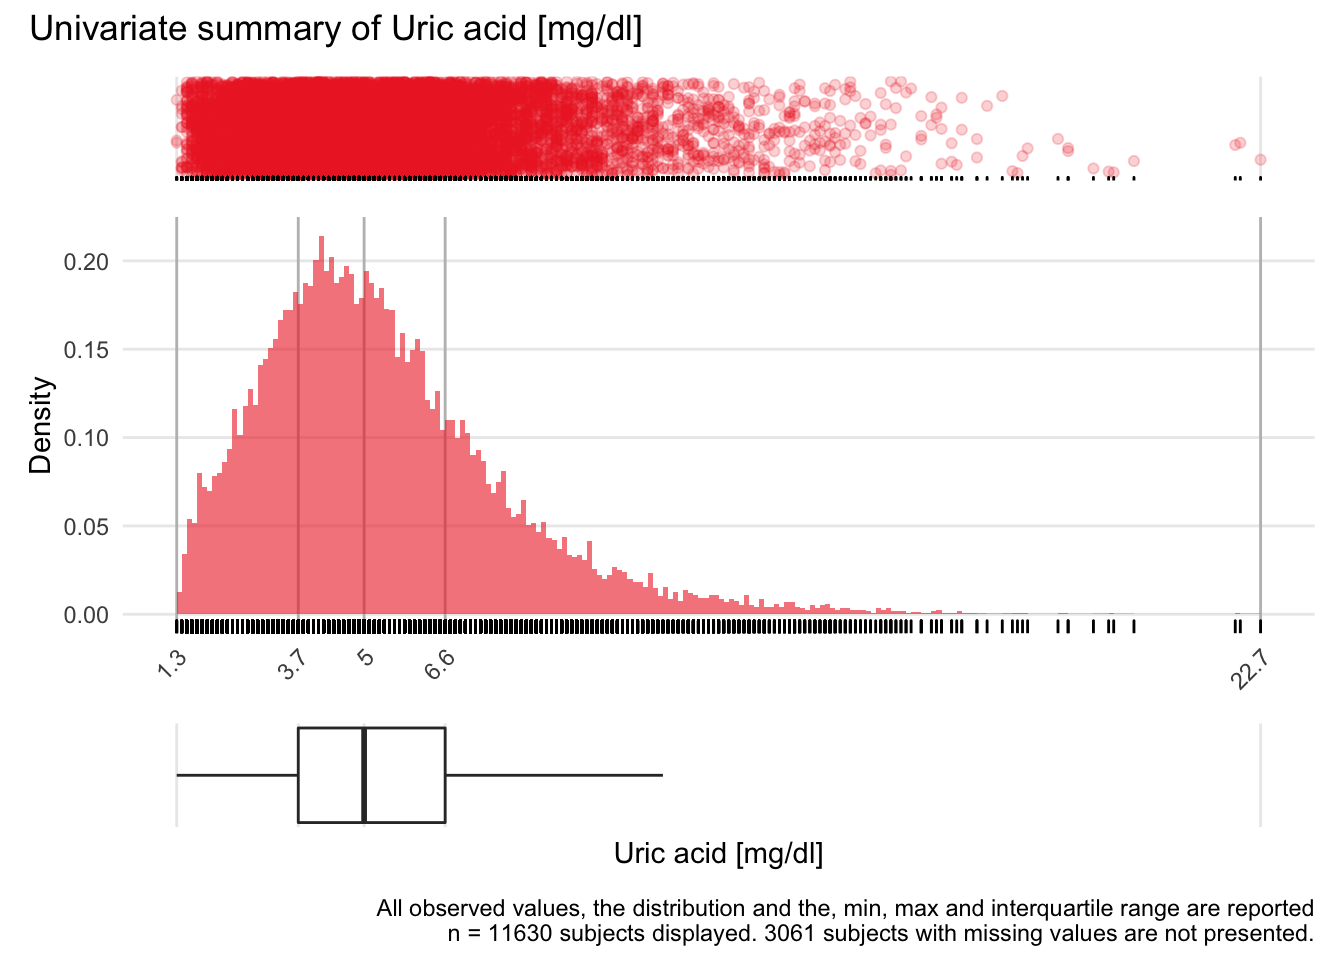
HS: Uric acid mg/dl

| n | missing | distinct | Info | Mean | Gmd | .05 | .10 | .25 | .50 | .75 | .90 | .95 |
|---|---|---|---|---|---|---|---|---|---|---|---|---|
| 11630 | 3061 | 169 | 1 | 5.413 | 2.625 | 2.2 | 2.7 | 3.7 | 5.0 | 6.6 | 8.5 | 10.0 |
GBIL: Bilirubin mg/dl

| n | missing | distinct | Info | Mean | Gmd | .05 | .10 | .25 | .50 | .75 | .90 | .95 |
|---|---|---|---|---|---|---|---|---|---|---|---|---|
| 13250 | 1441 | 885 | 1 | 1.406 | 1.477 | 0.33 | 0.39 | 0.53 | 0.77 | 1.23 | 2.34 | 3.96 |
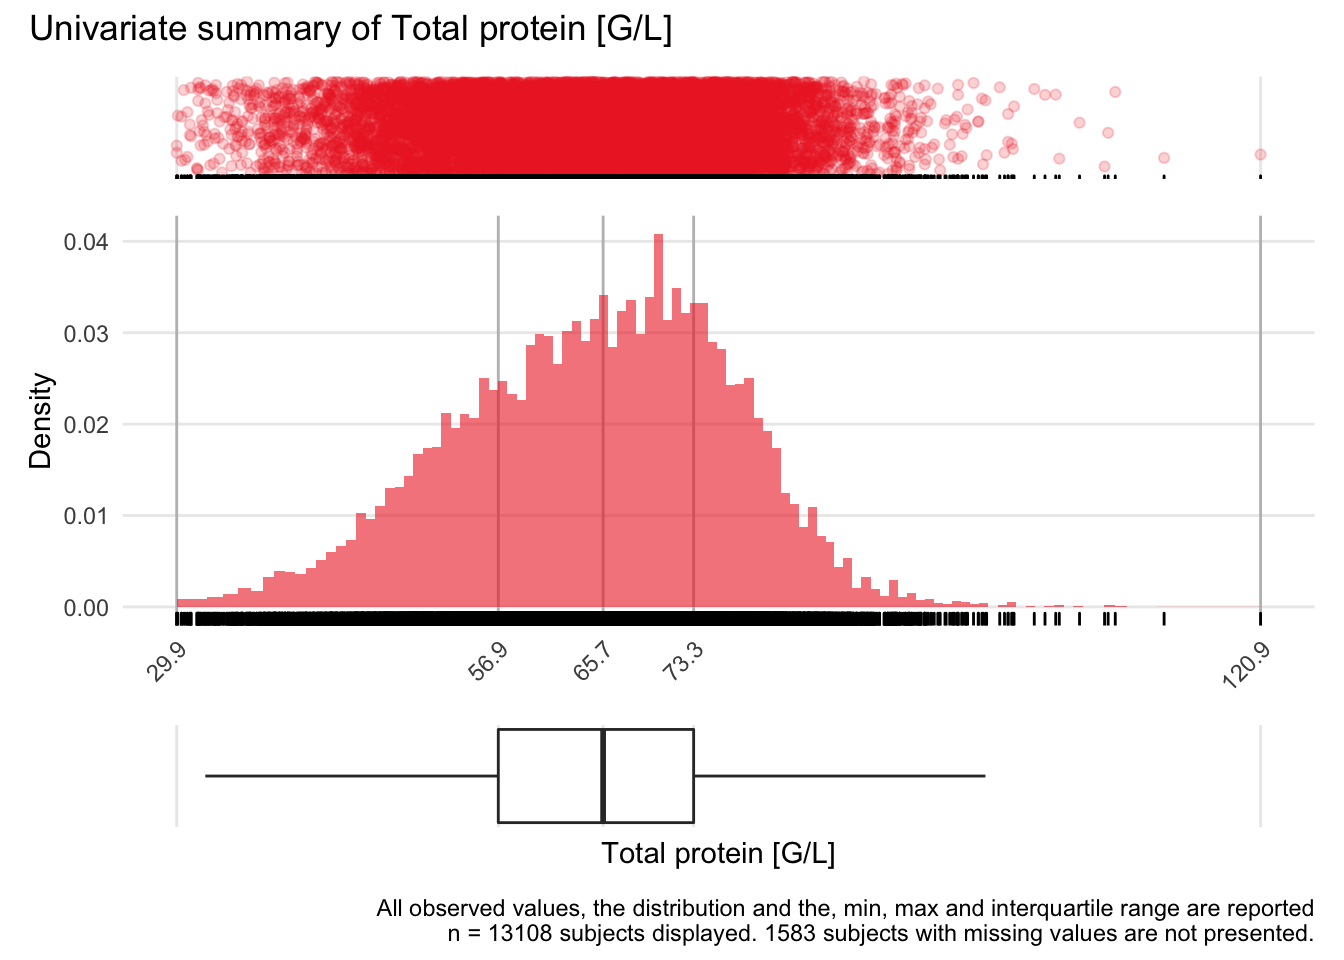
TP: Total protein G/L

| n | missing | distinct | Info | Mean | Gmd | .05 | .10 | .25 | .50 | .75 | .90 | .95 |
|---|---|---|---|---|---|---|---|---|---|---|---|---|
| 13108 | 1583 | 649 | 1 | 64.9 | 12.97 | 45.20 | 49.47 | 56.90 | 65.70 | 73.30 | 78.80 | 82.00 |
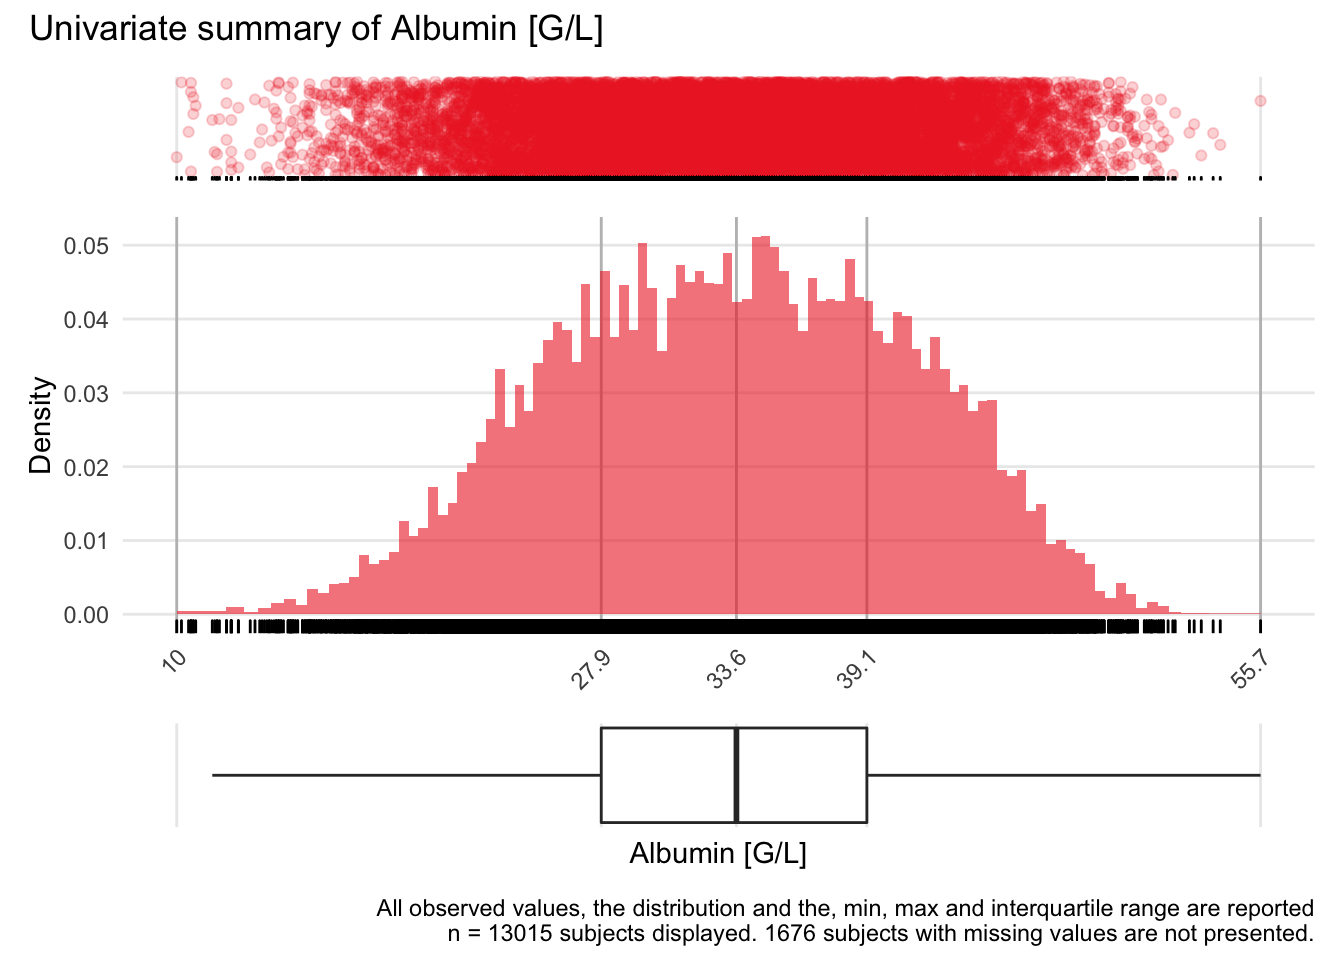
ALB: Albumin G/L

| n | missing | distinct | Info | Mean | Gmd | .05 | .10 | .25 | .50 | .75 | .90 | .95 |
|---|---|---|---|---|---|---|---|---|---|---|---|---|
| 13015 | 1676 | 401 | 1 | 33.42 | 8.513 | 21.3 | 23.6 | 27.9 | 33.6 | 39.1 | 43.2 | 45.2 |
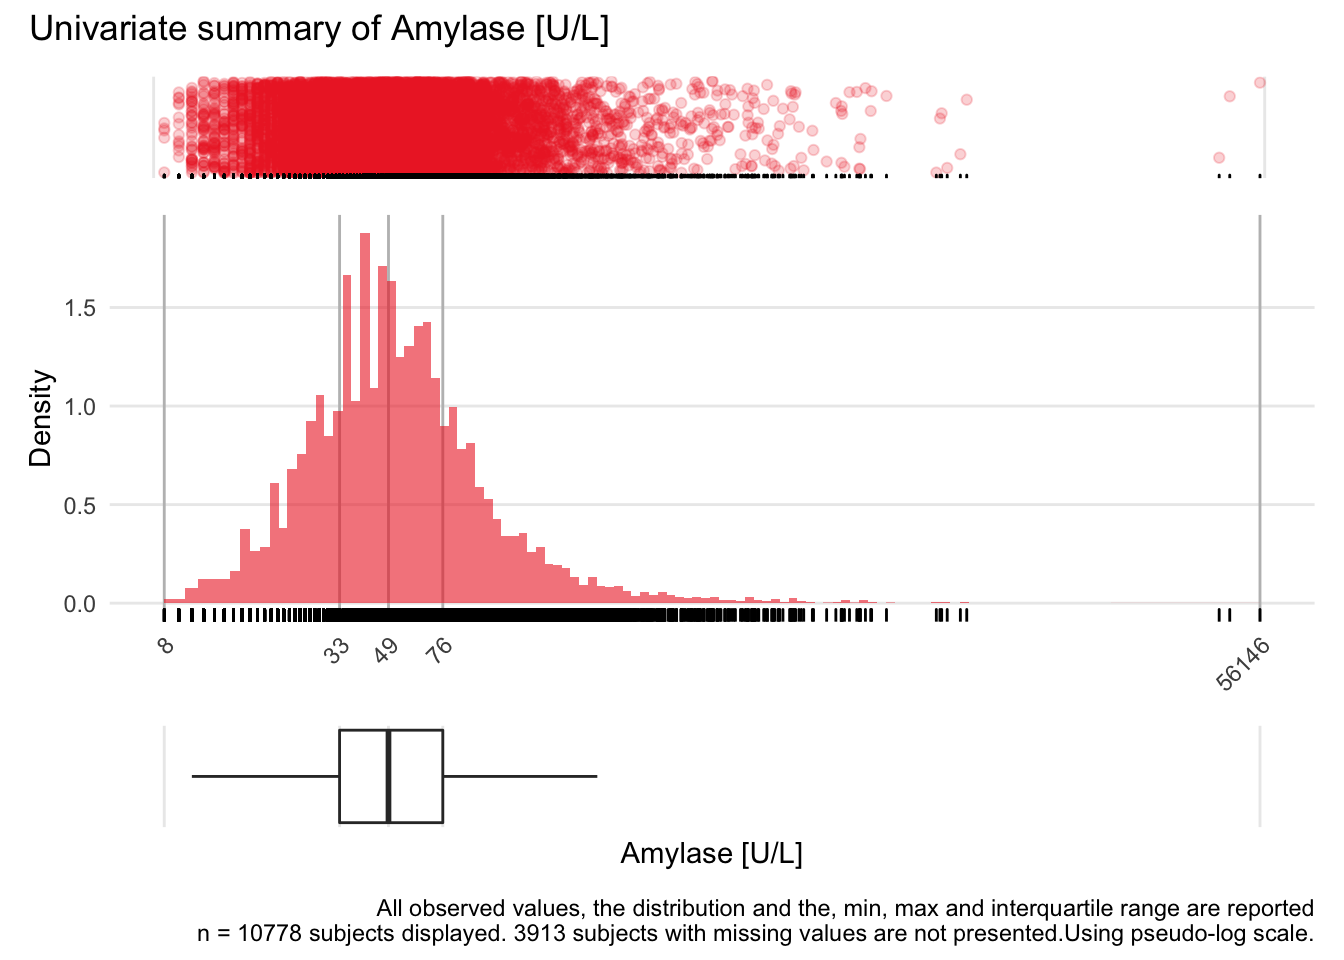
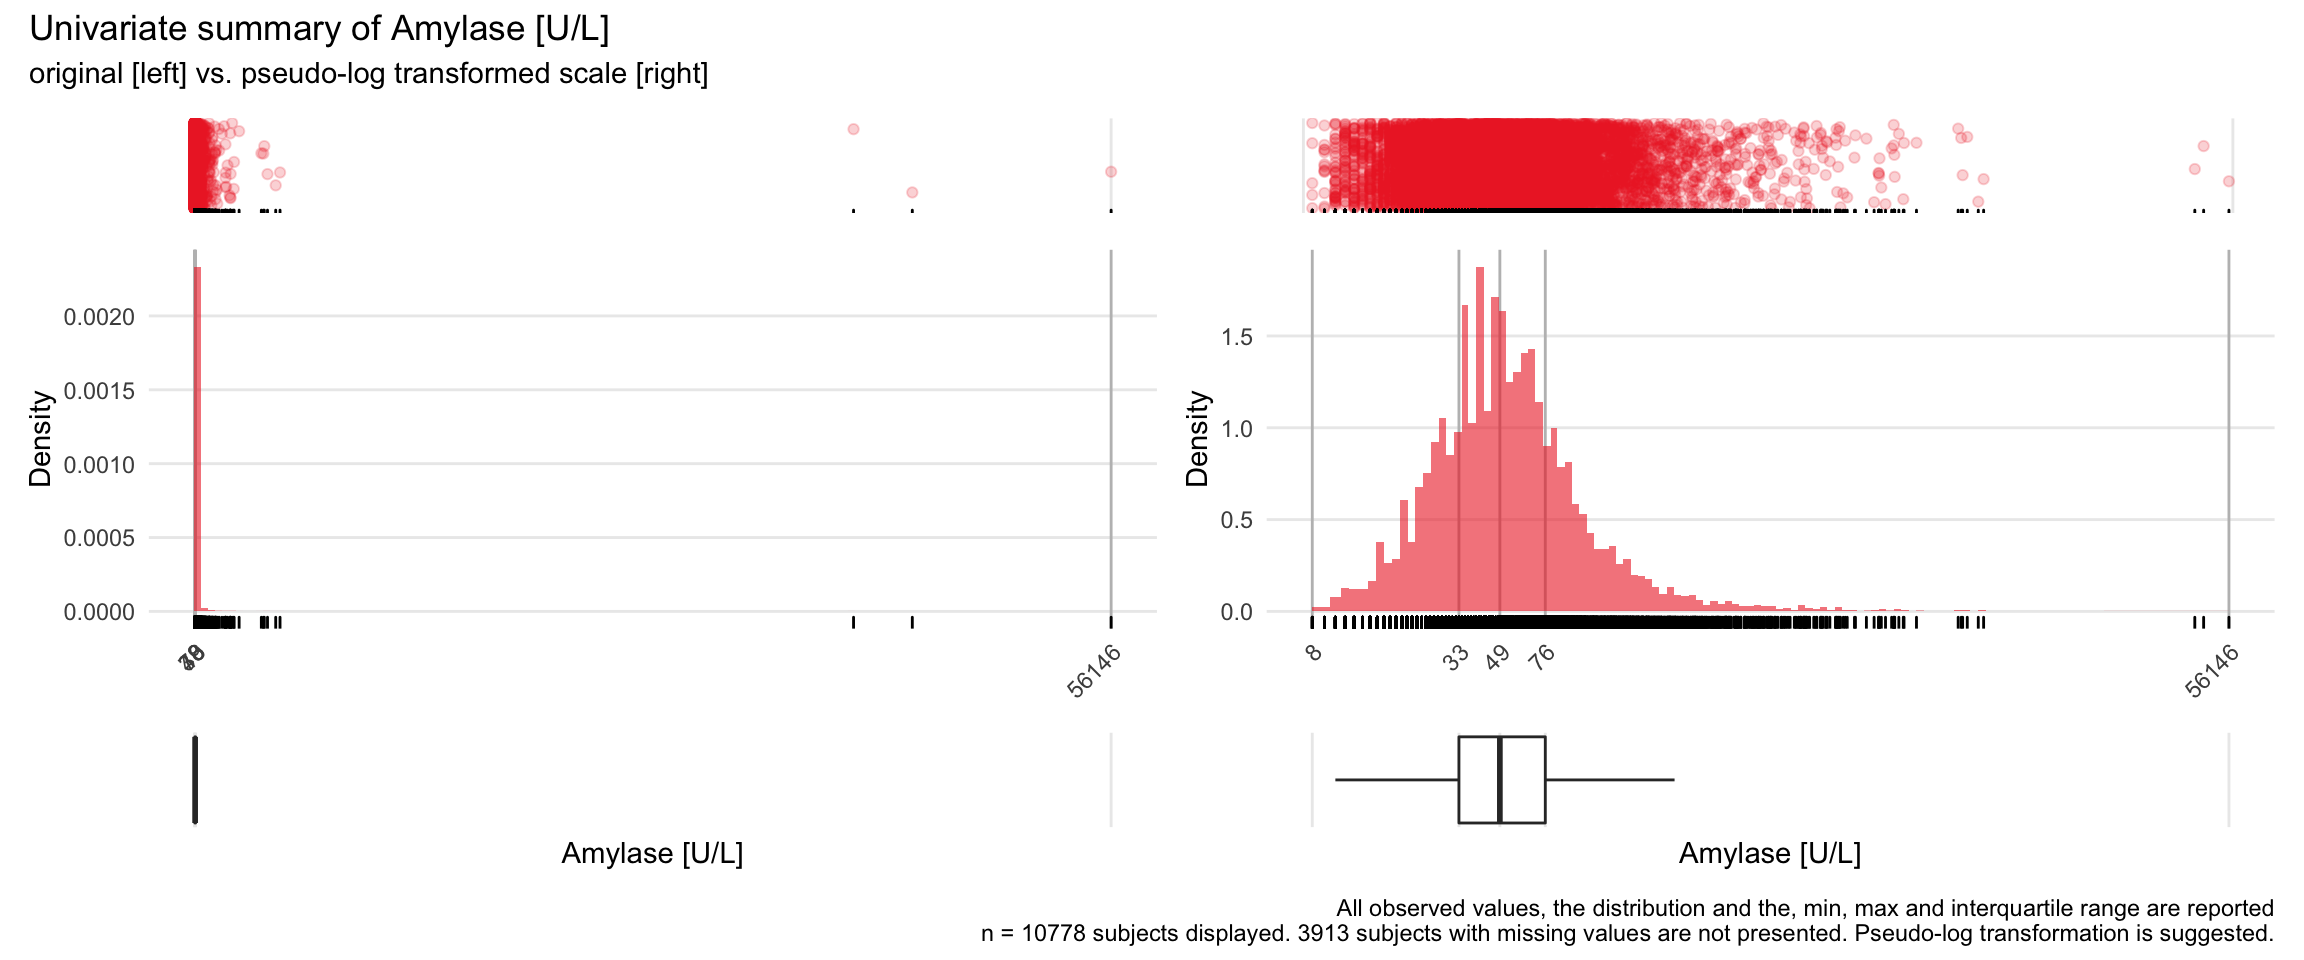
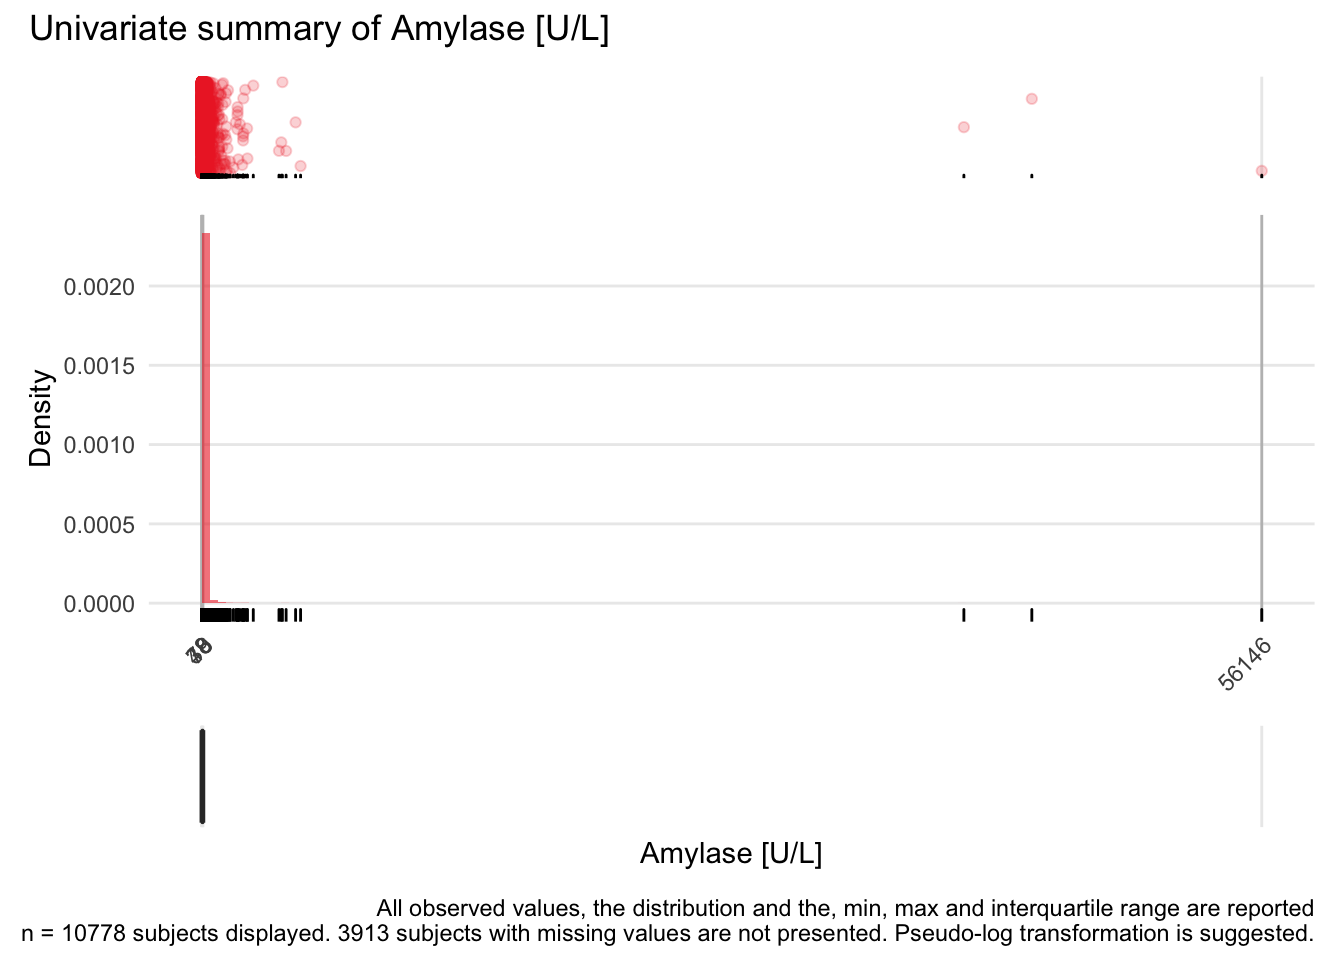
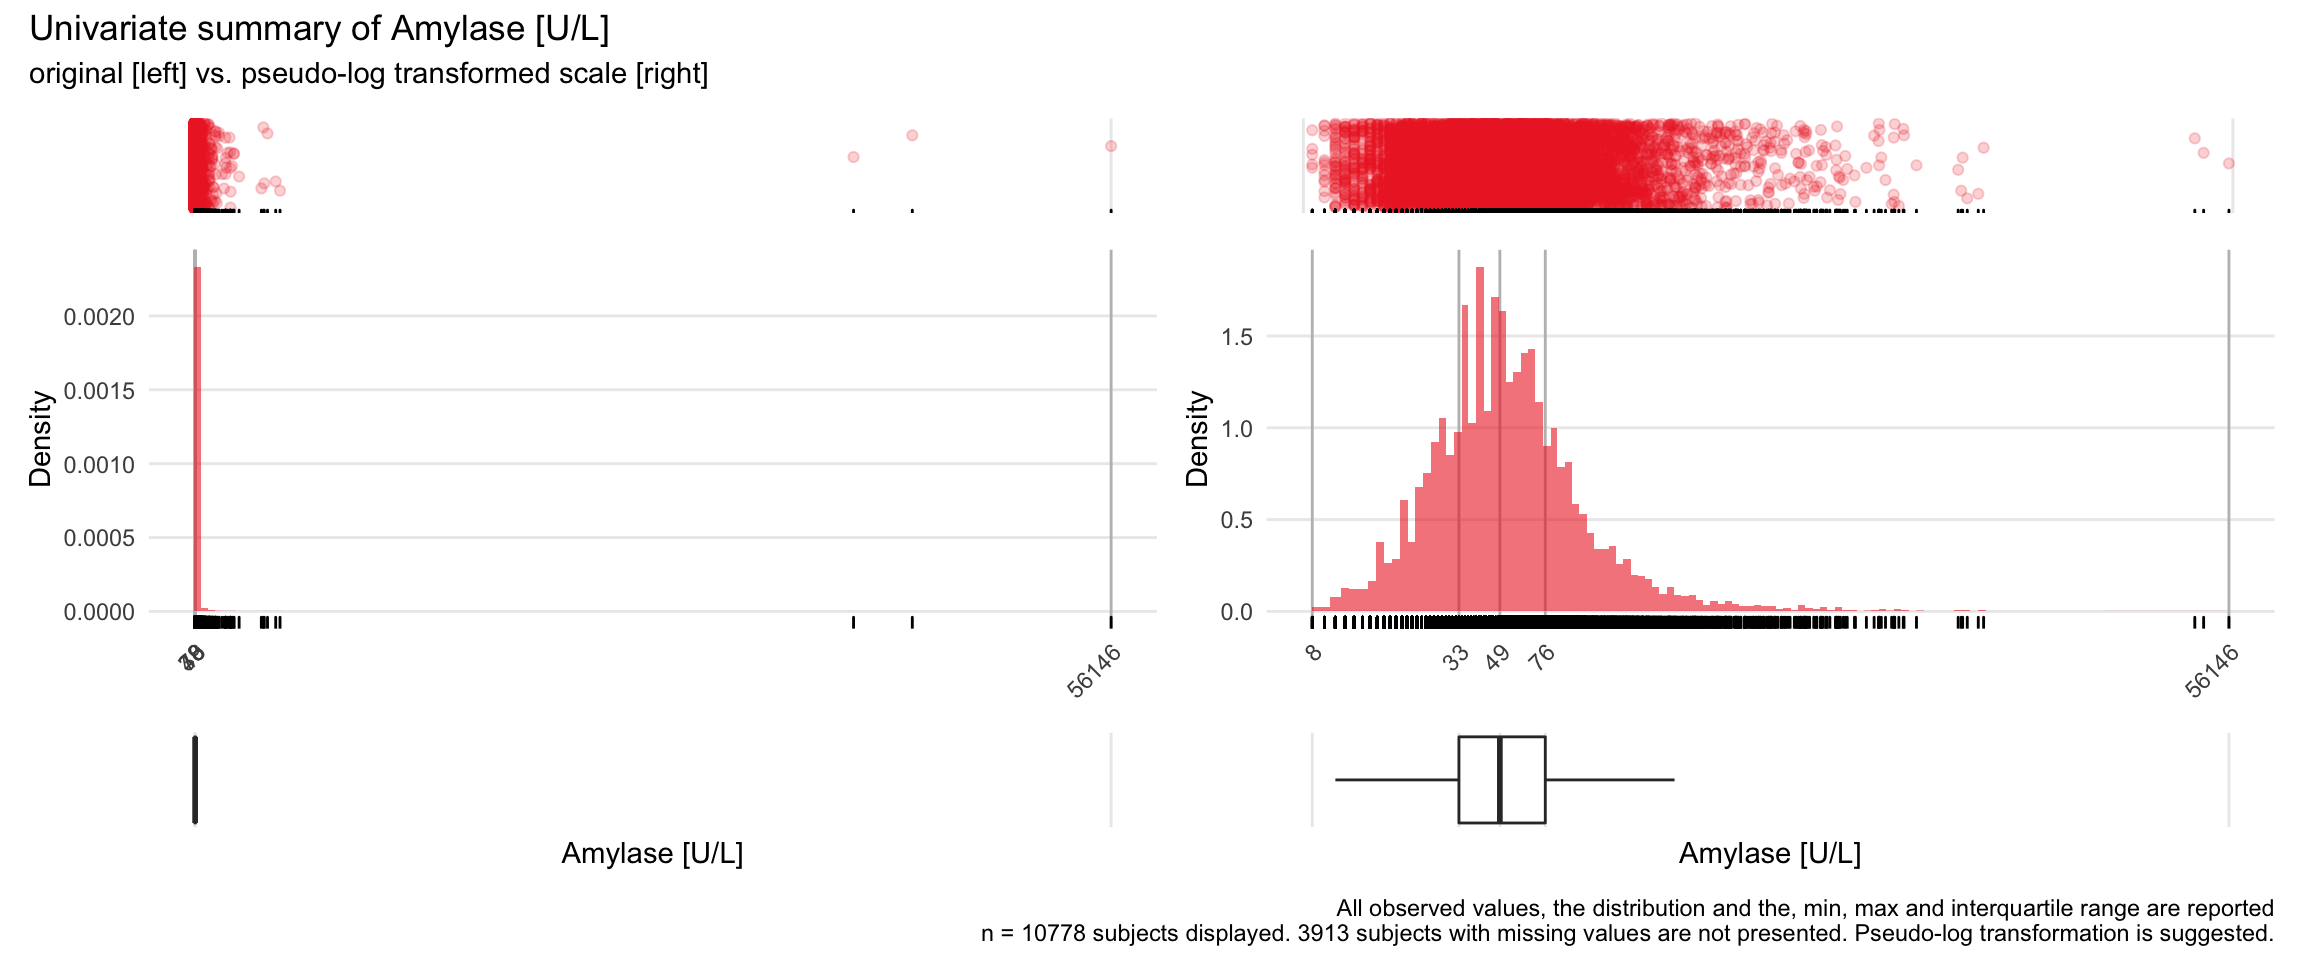
AMY: Amylase U/L

| n | missing | distinct | Info | Mean | Gmd | .05 | .10 | .25 | .50 | .75 | .90 | .95 |
|---|---|---|---|---|---|---|---|---|---|---|---|---|
| 10778 | 3913 | 488 | 1 | 90.83 | 100.5 | 18 | 23 | 33 | 49 | 76 | 125 | 187 |
 Value          0   500  1000  1500  2000  2500  4000  4500  5000 40500 44000 56000
 Frequency  10432   268    39    14    12     4     2     2     2     1     1     1
 Proportion 0.968 0.025 0.004 0.001 0.001 0.000 0.000 0.000 0.000 0.000 0.000 0.000
For the frequency table, variable is rounded to the nearest 500
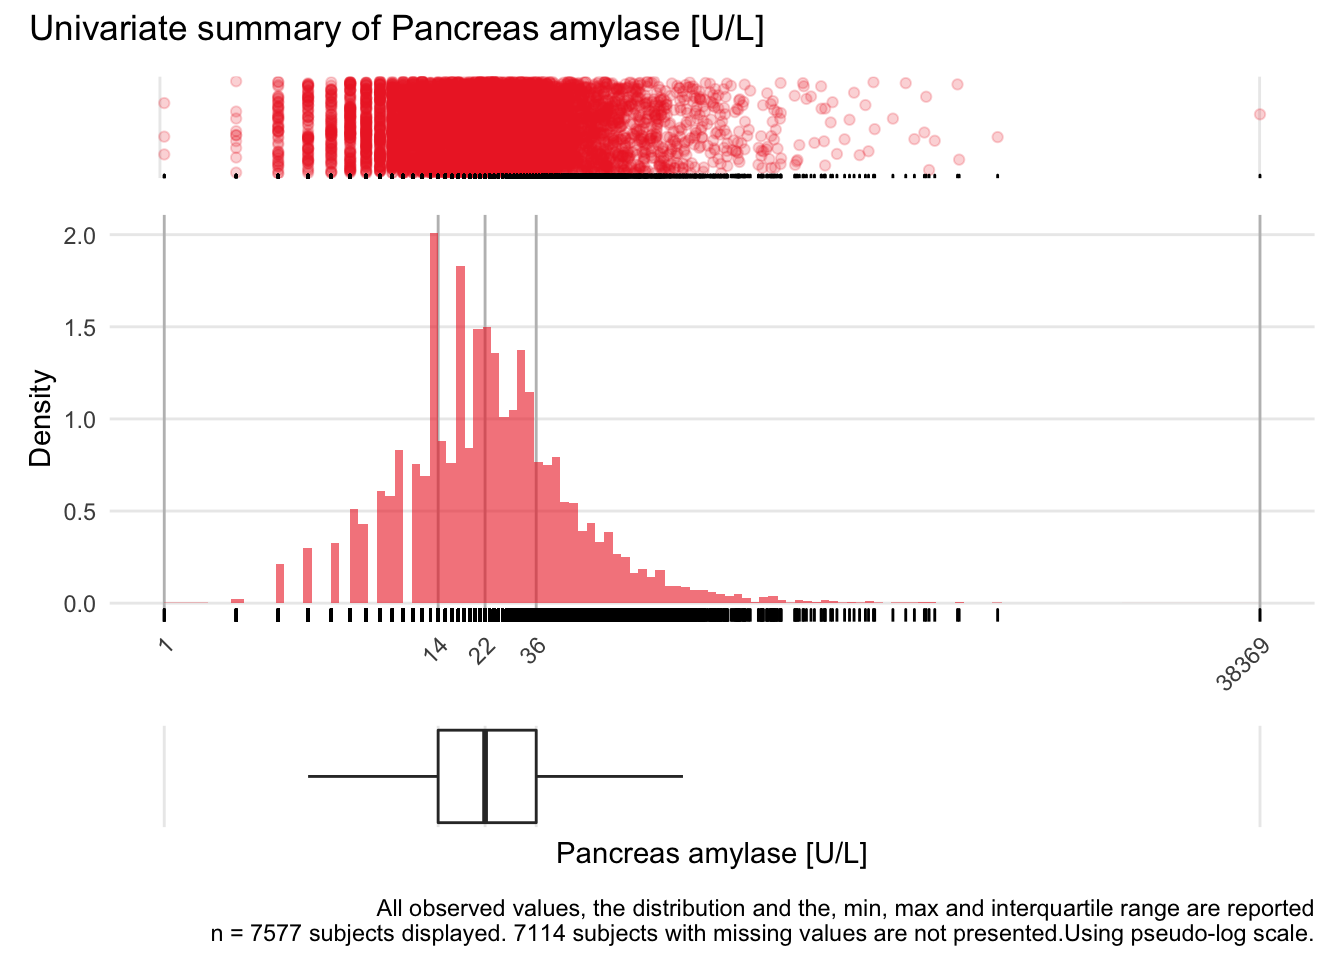
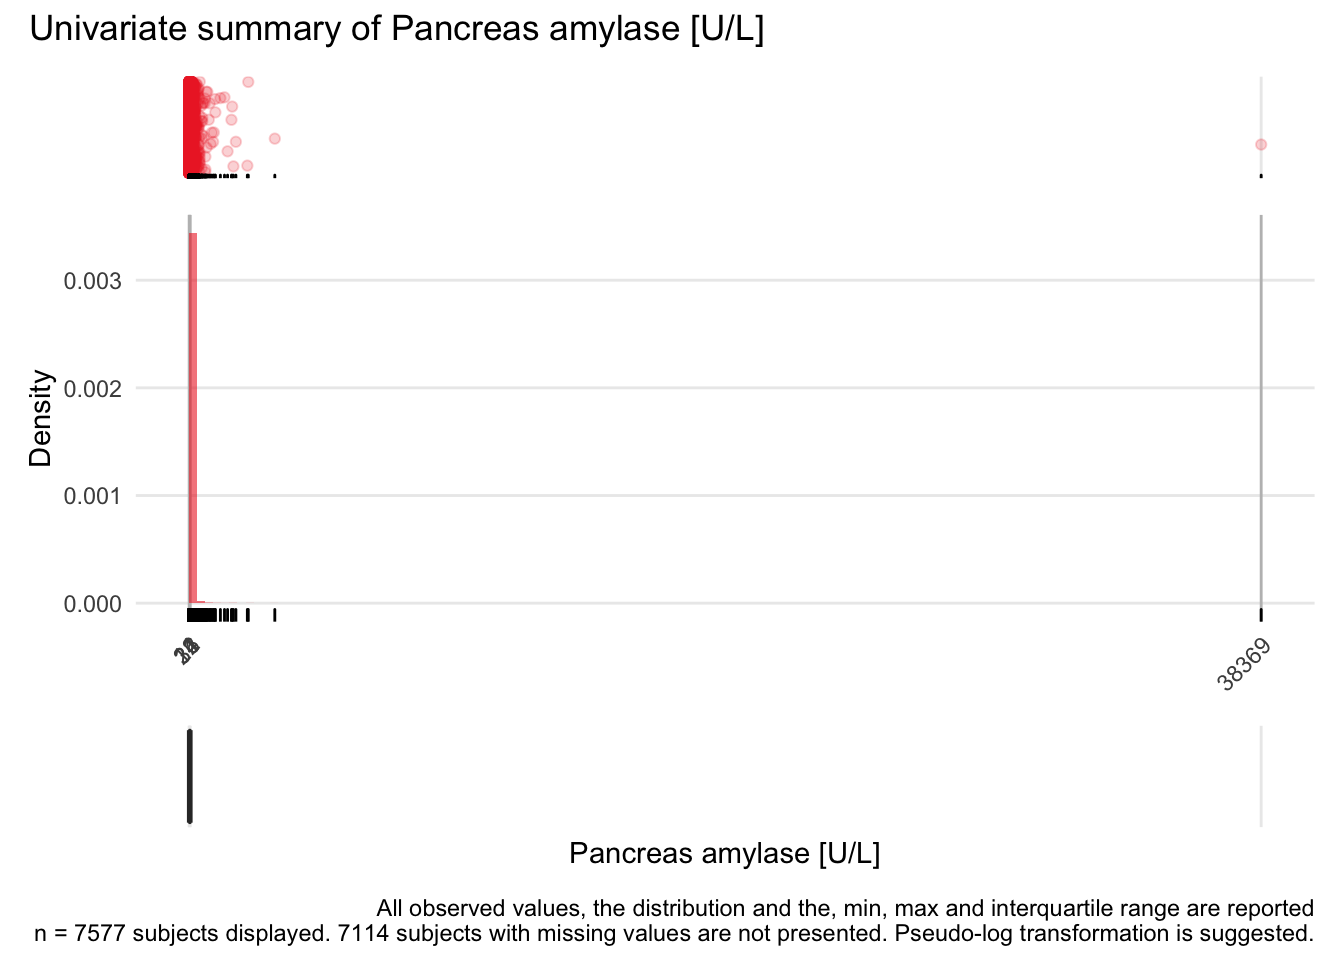
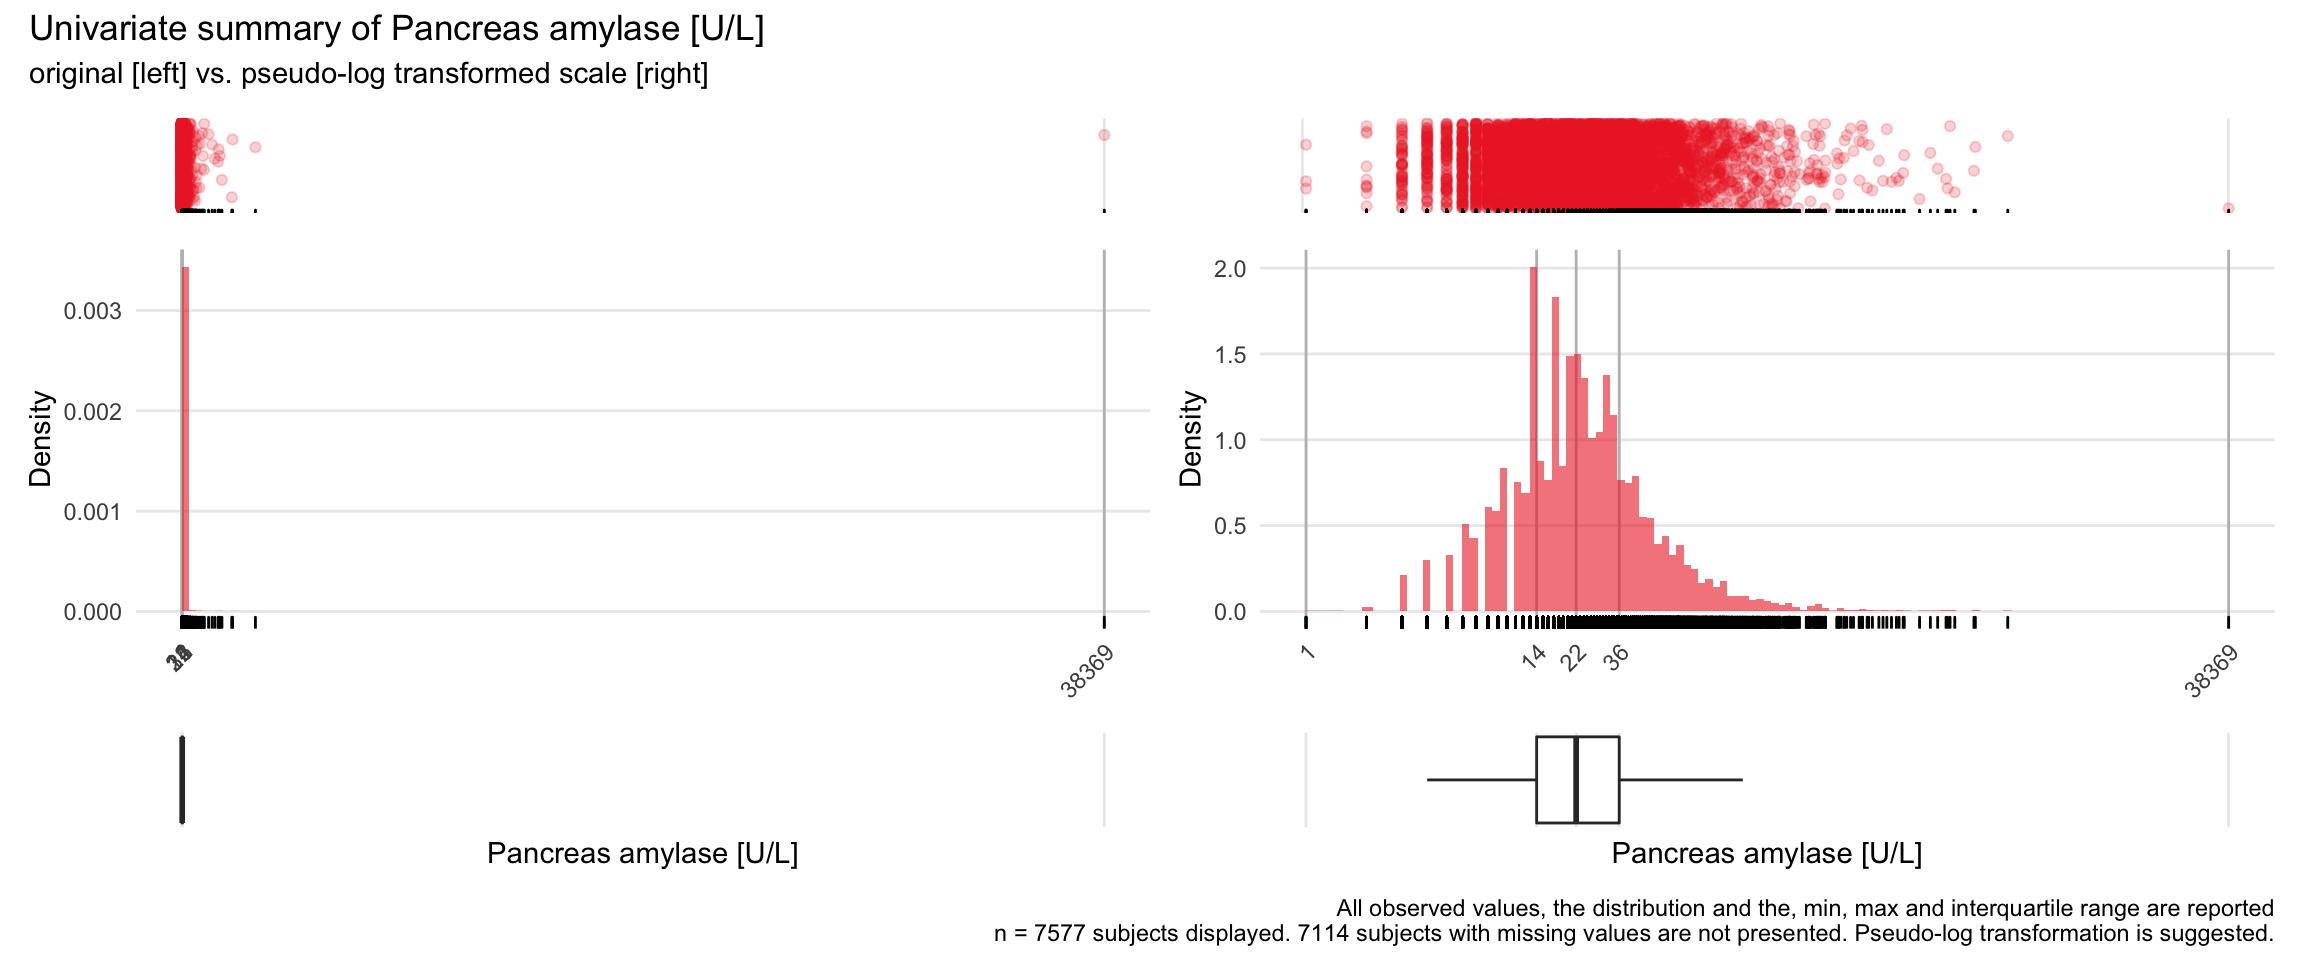
PAMY: Pancreas amylase U/L

| n | missing | distinct | Info | Mean | Gmd | .05 | .10 | .25 | .50 | .75 | .90 | .95 |
|---|---|---|---|---|---|---|---|---|---|---|---|---|
| 7577 | 7114 | 280 | 0.999 | 41.66 | 47.28 | 7 | 9 | 14 | 22 | 36 | 64 | 97 |
 Value          0   500  1000  1500  2000  3000 38500
 Frequency   7495    65     7     6     2     1     1
 Proportion 0.989 0.009 0.001 0.001 0.000 0.000 0.000
For the frequency table, variable is rounded to the nearest 500
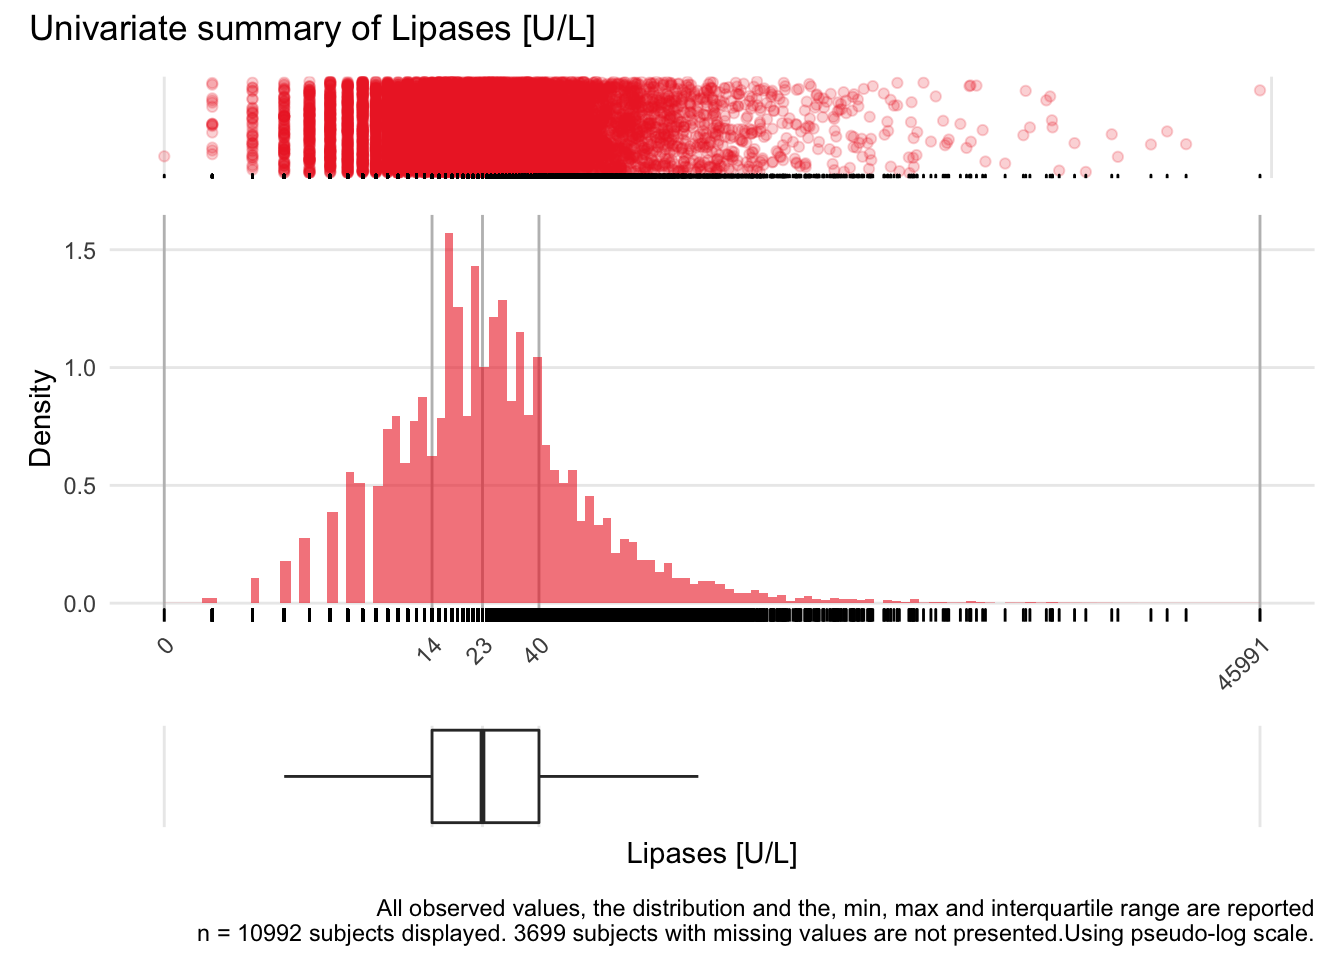
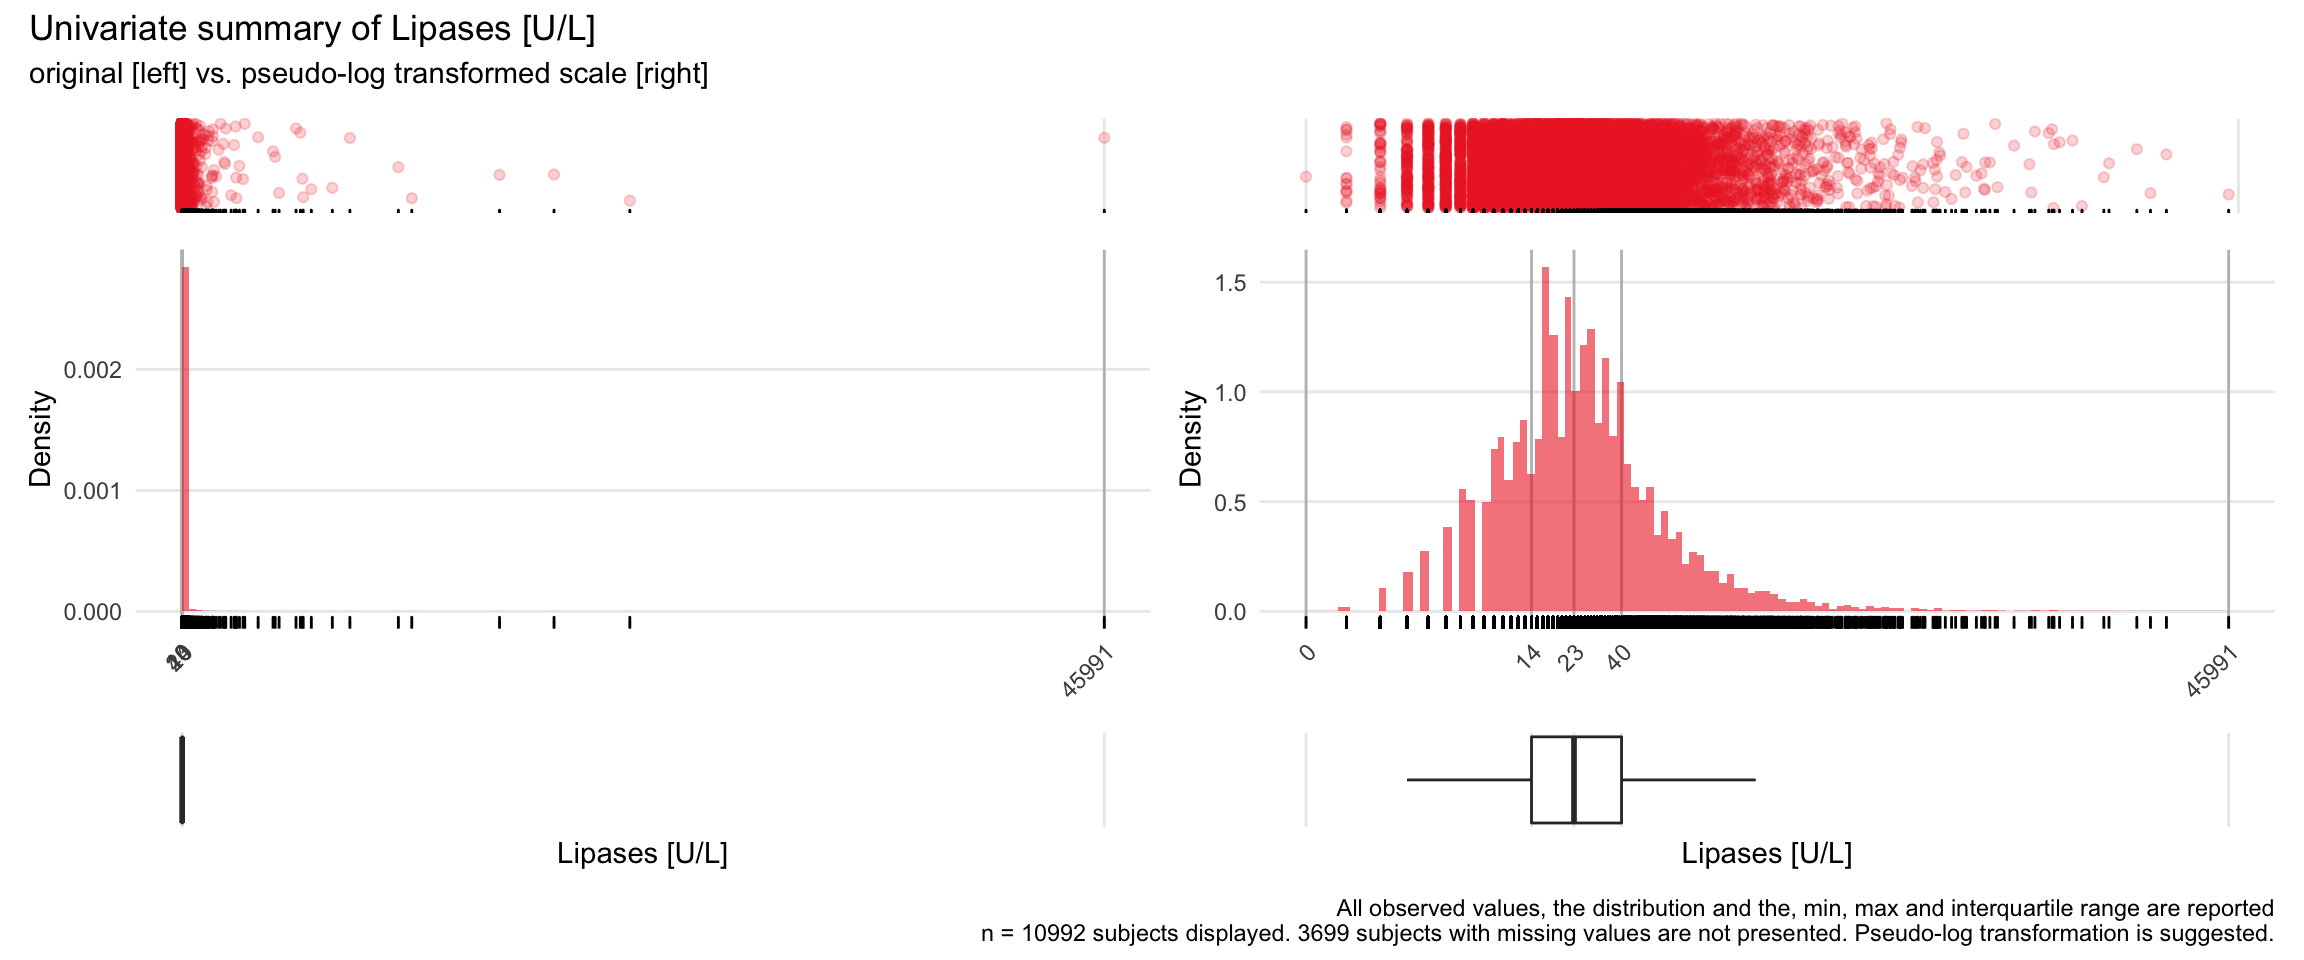
LIP: Lipases U/L

| n | missing | distinct | Info | Mean | Gmd | .05 | .10 | .25 | .50 | .75 | .90 | .95 |
|---|---|---|---|---|---|---|---|---|---|---|---|---|
| 10992 | 3699 | 444 | 1 | 63.82 | 89.88 | 6 | 8 | 14 | 23 | 40 | 79 | 135 |
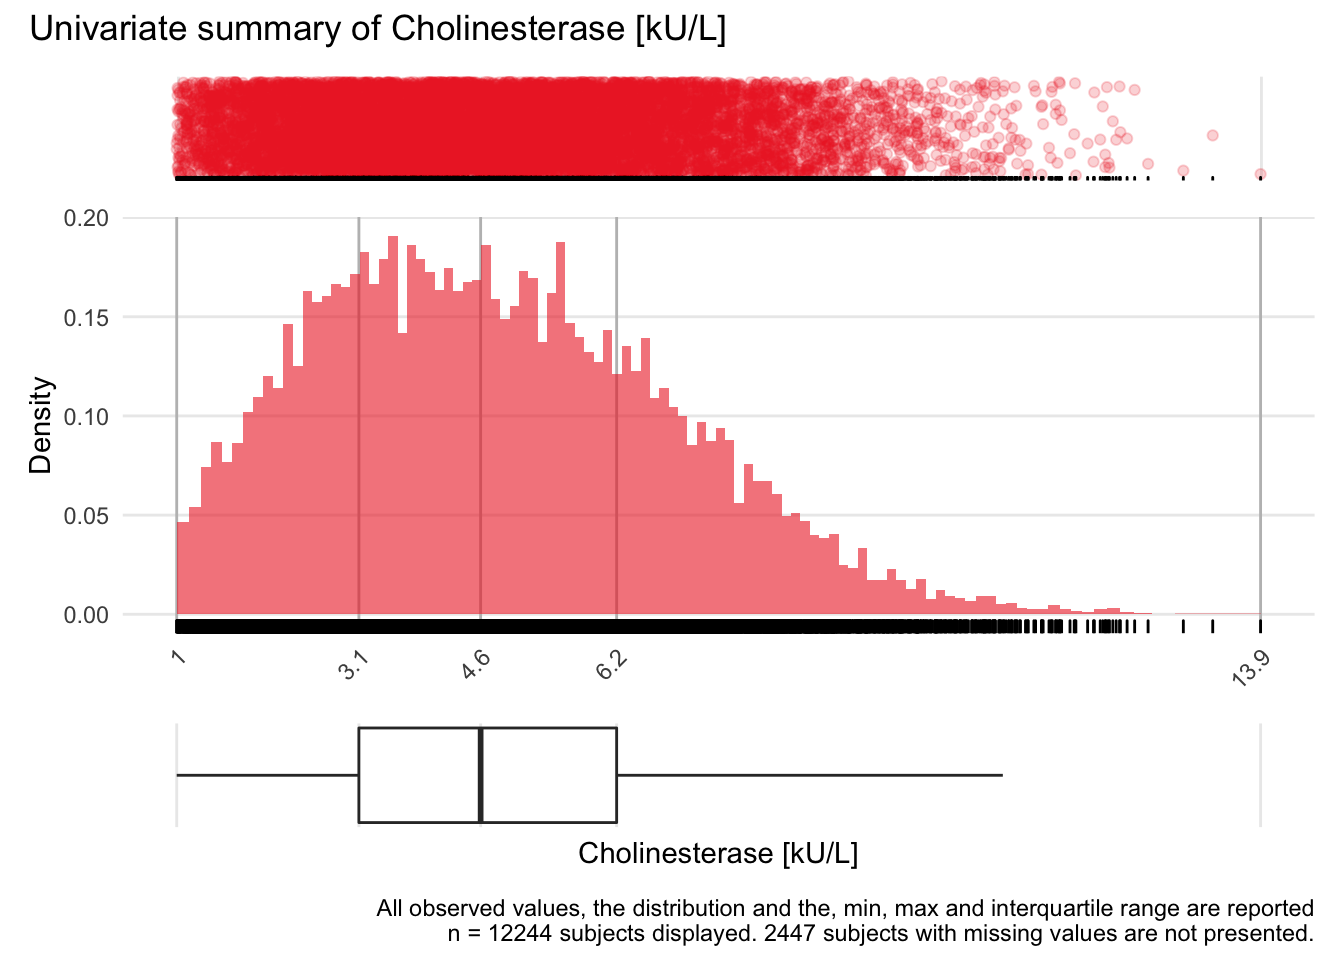
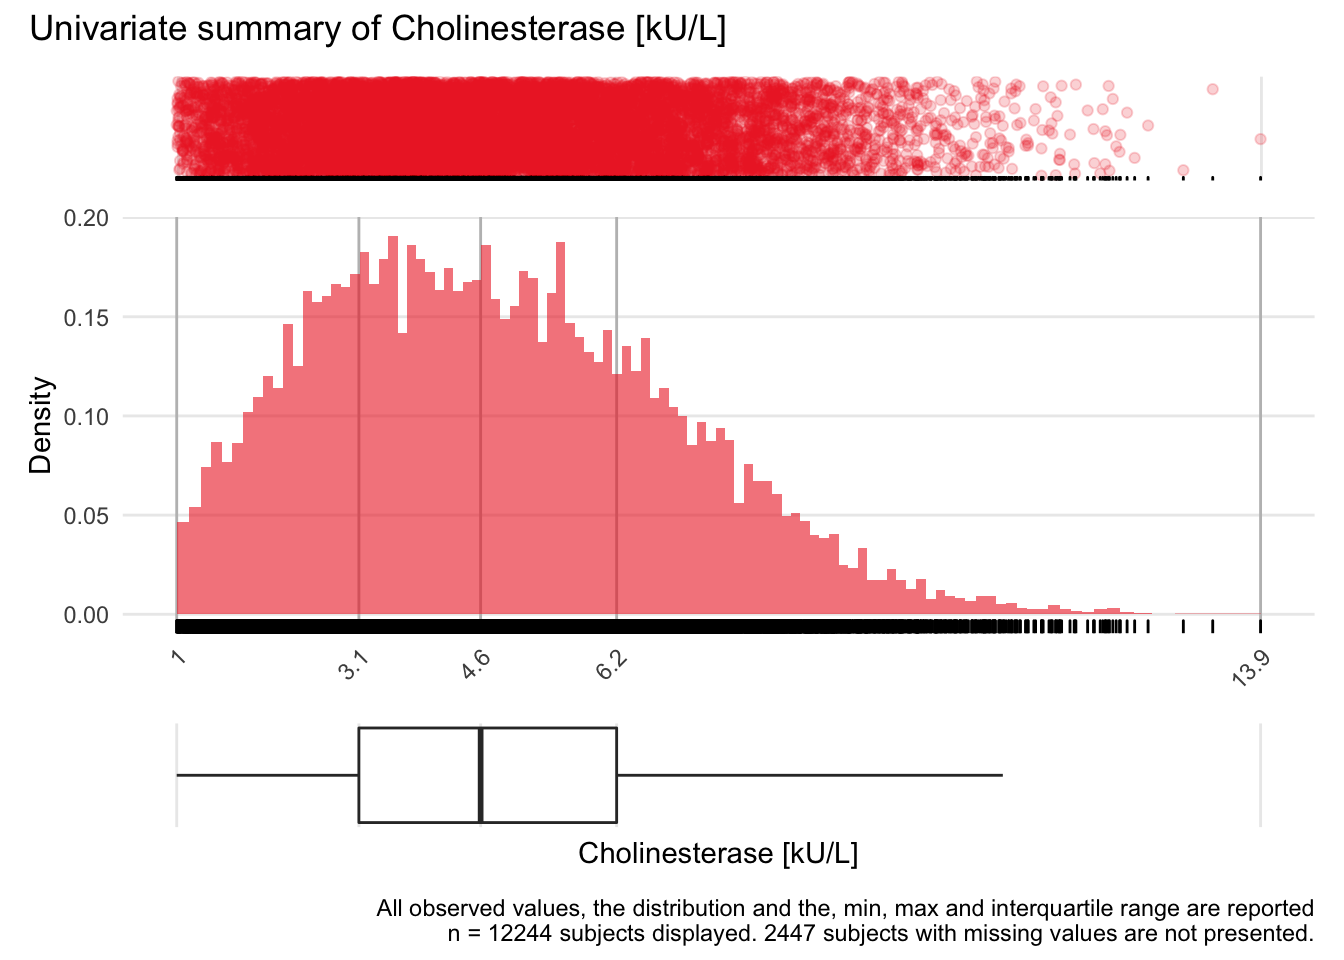
CHE: Cholinesterase kU/L

| n | missing | distinct | Info | Mean | Gmd | .05 | .10 | .25 | .50 | .75 | .90 | .95 |
|---|---|---|---|---|---|---|---|---|---|---|---|---|
| 12244 | 2447 | 997 | 1 | 4.79 | 2.378 | 1.70 | 2.17 | 3.15 | 4.60 | 6.22 | 7.65 | 8.49 |
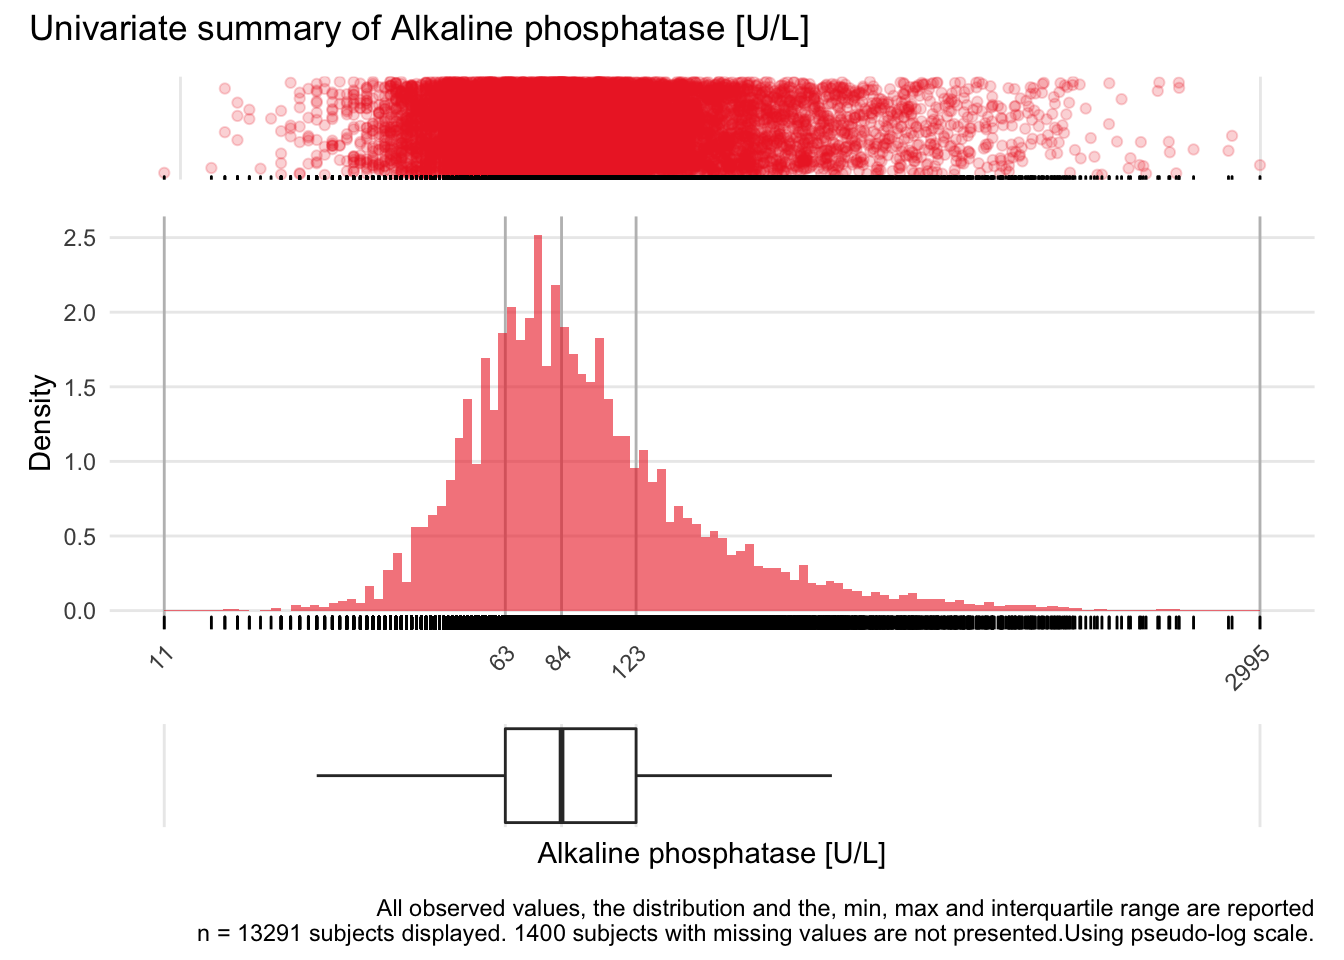
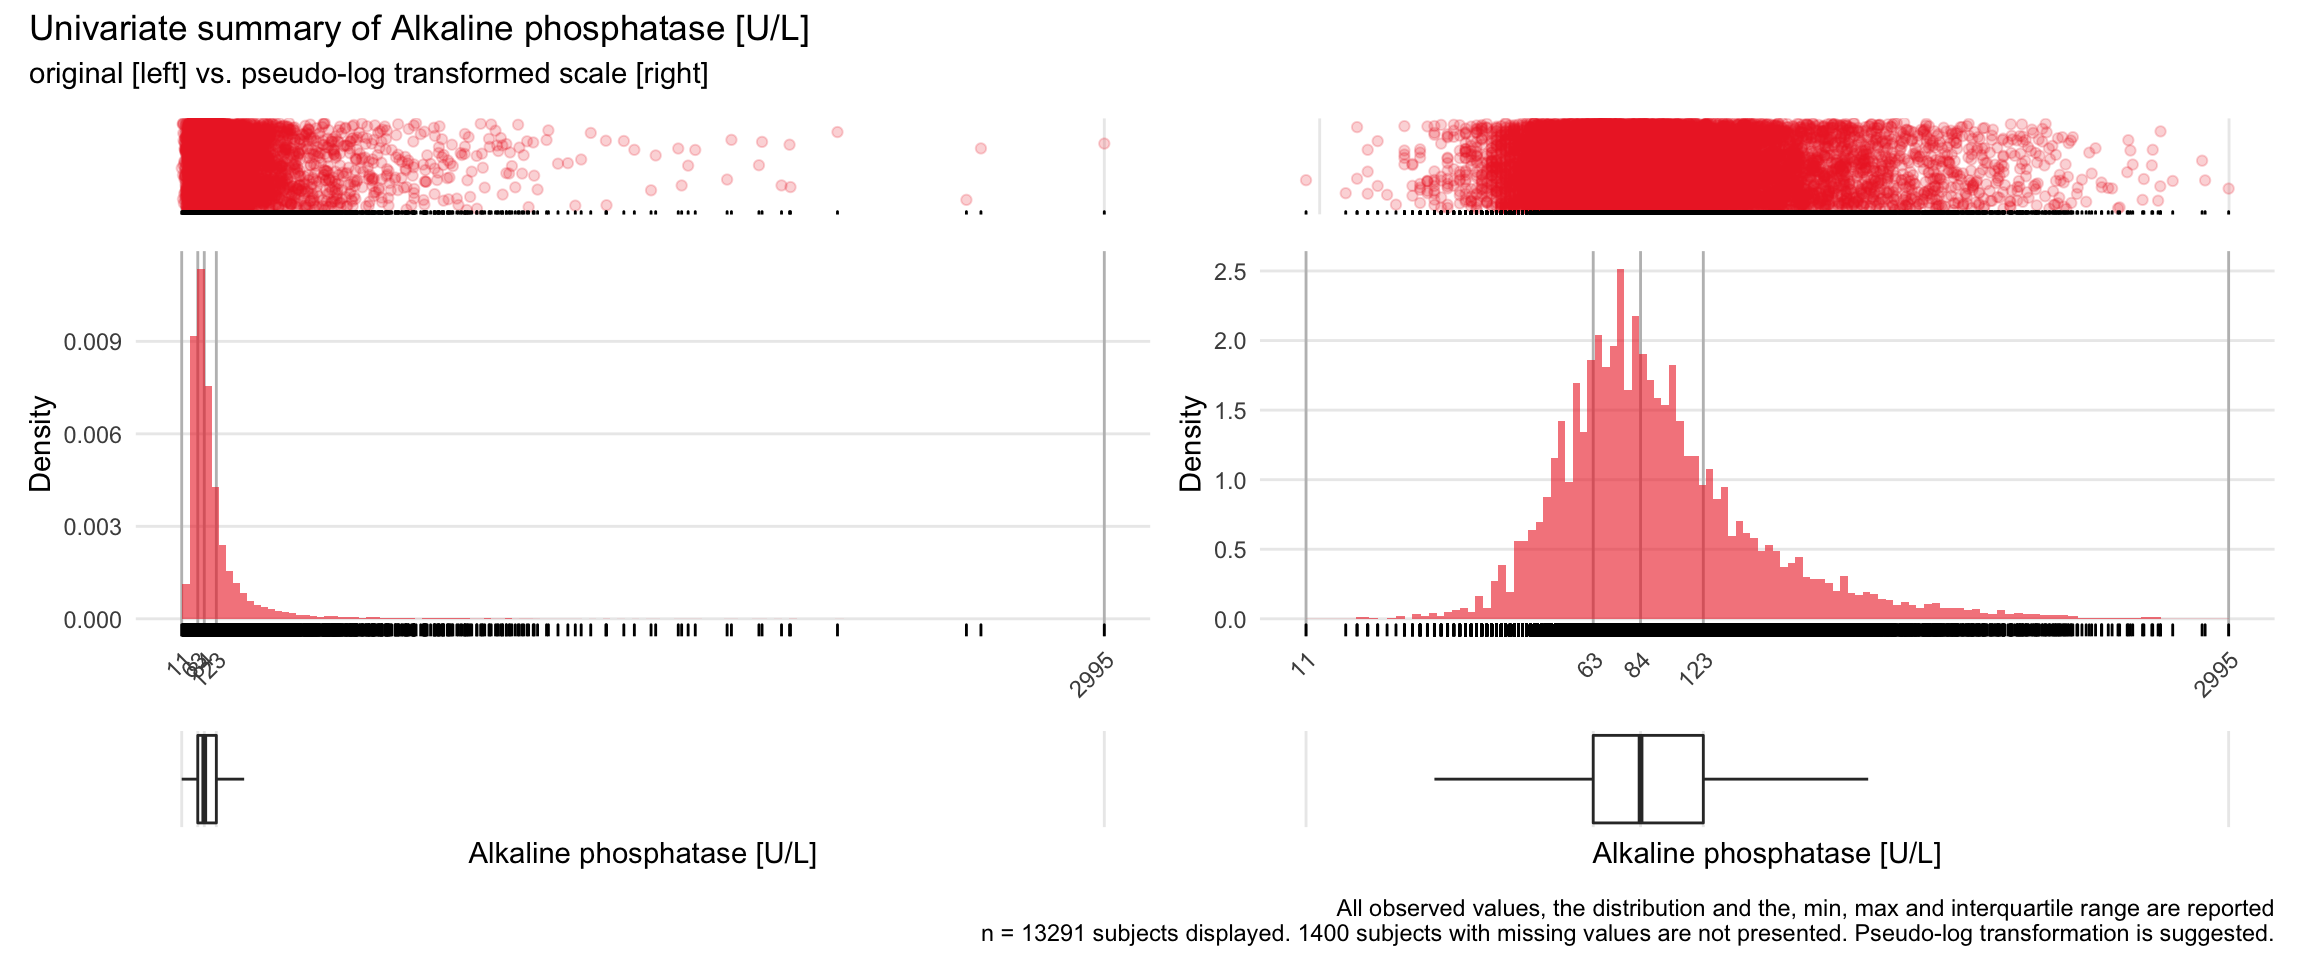
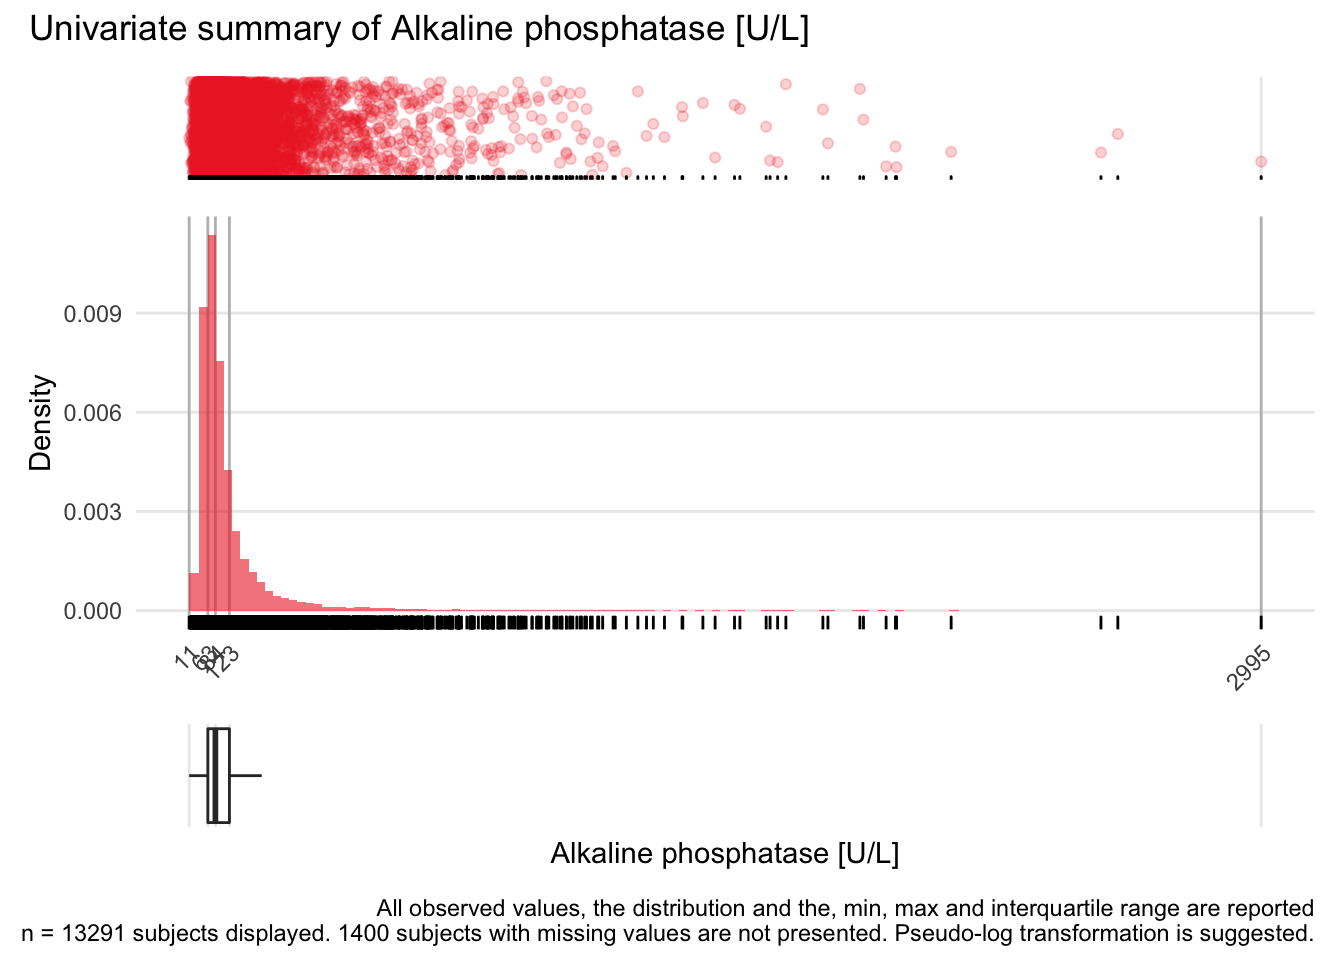
AP: Alkaline phosphatase U/L

| n | missing | distinct | Info | Mean | Gmd | .05 | .10 | .25 | .50 | .75 | .90 | .95 |
|---|---|---|---|---|---|---|---|---|---|---|---|---|
| 13291 | 1400 | 672 | 1 | 118.8 | 91.51 | 42 | 49 | 63 | 84 | 123 | 206 | 302 |
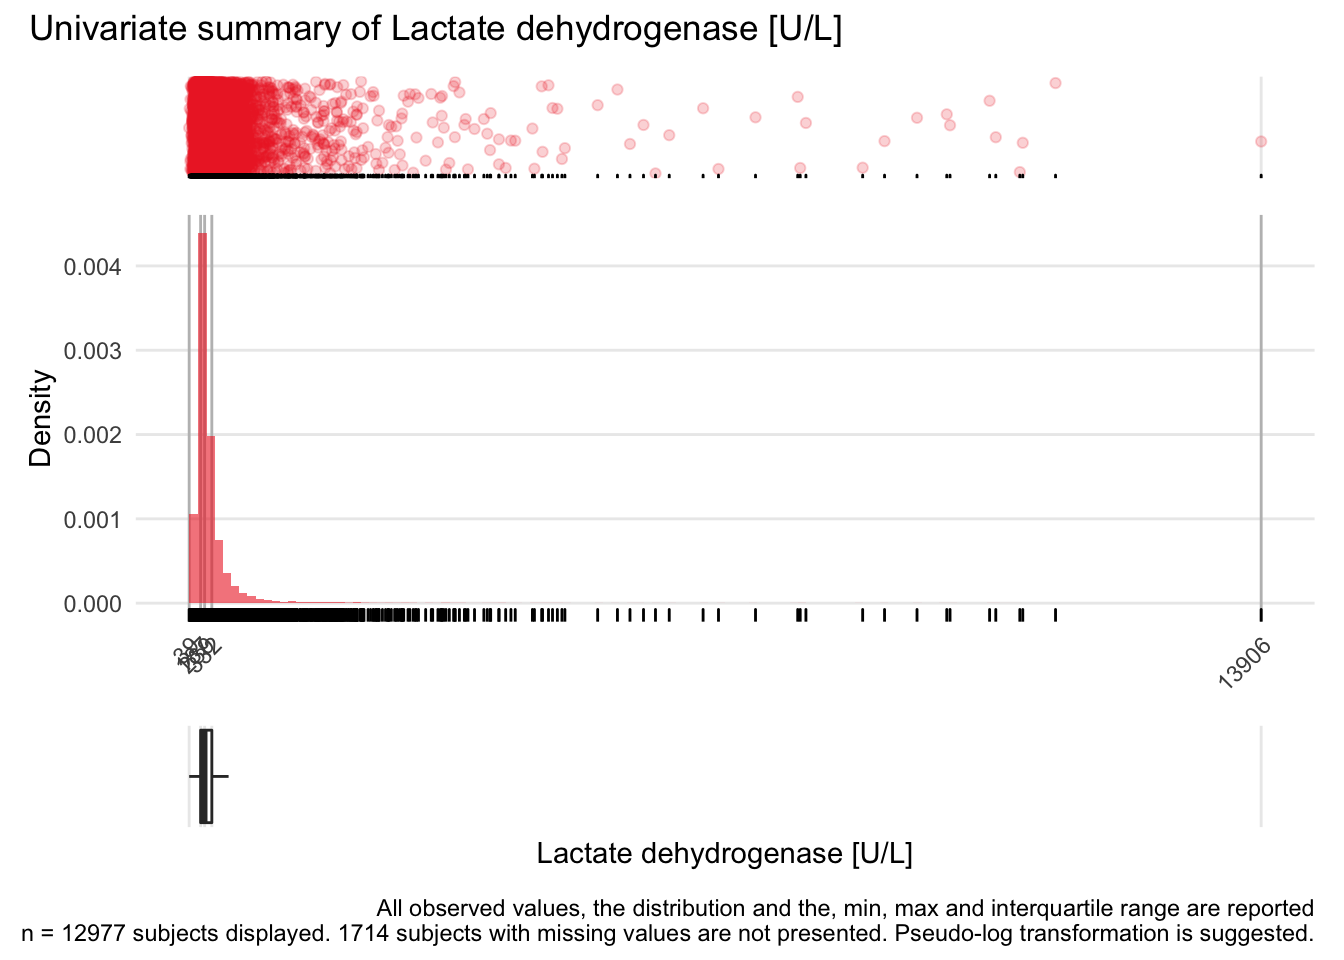
LDH: Lactate dehydrogenase U/L

| n | missing | distinct | Info | Mean | Gmd | .05 | .10 | .25 | .50 | .75 | .90 | .95 |
|---|---|---|---|---|---|---|---|---|---|---|---|---|
| 12977 | 1714 | 1137 | 1 | 331.2 | 240.9 | 136 | 152 | 187 | 239 | 332 | 508 | 724 |
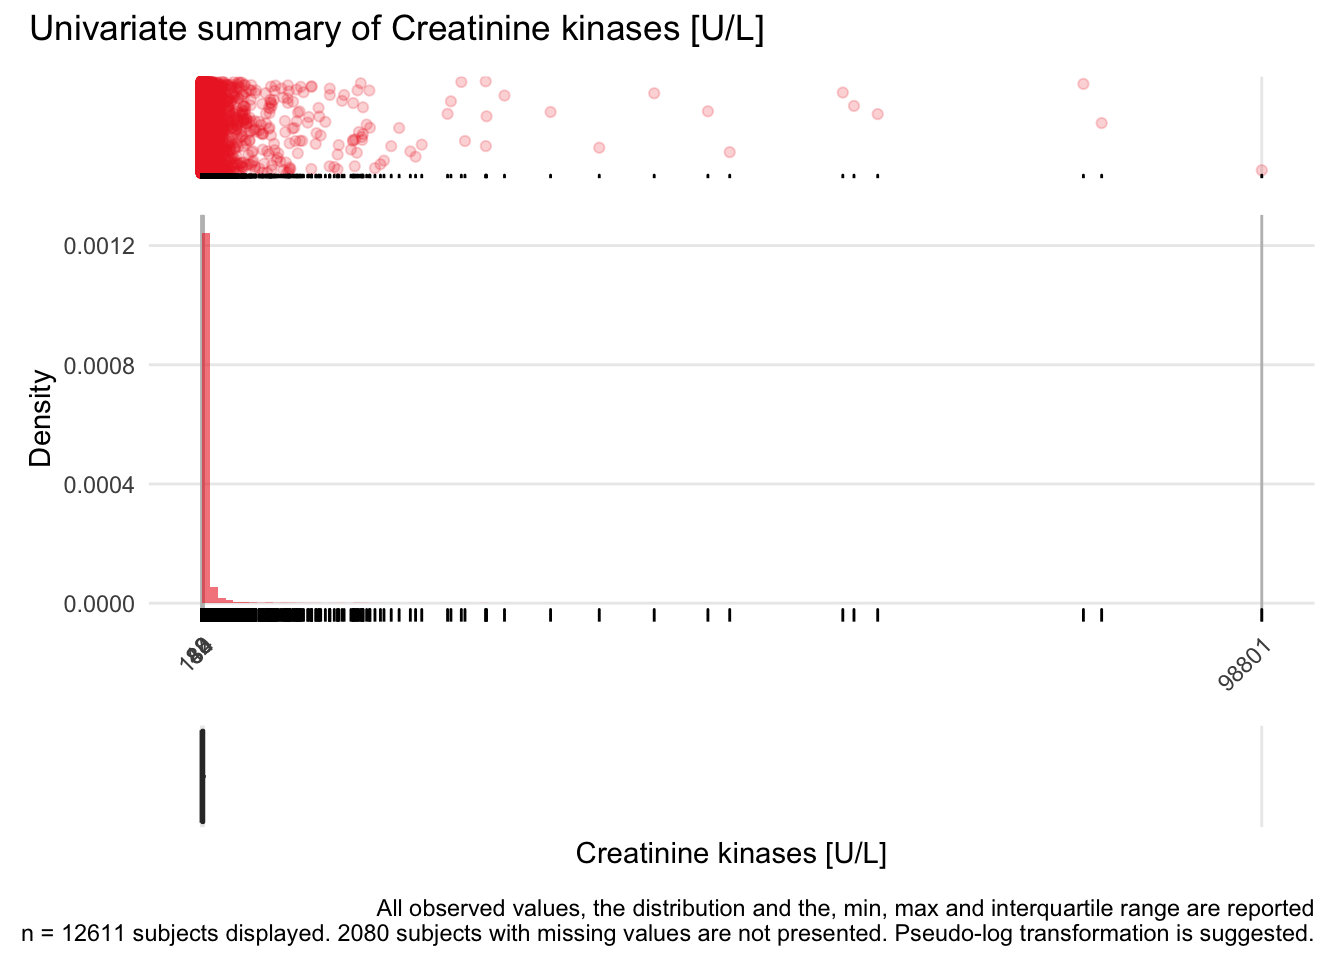
CK: Creatinine kinases U/L

| n | missing | distinct | Info | Mean | Gmd | .05 | .10 | .25 | .50 | .75 | .90 | .95 |
|---|---|---|---|---|---|---|---|---|---|---|---|---|
| 12611 | 2080 | 1506 | 1 | 385 | 615.4 | 18 | 25 | 42 | 80 | 184 | 577 | 1155 |
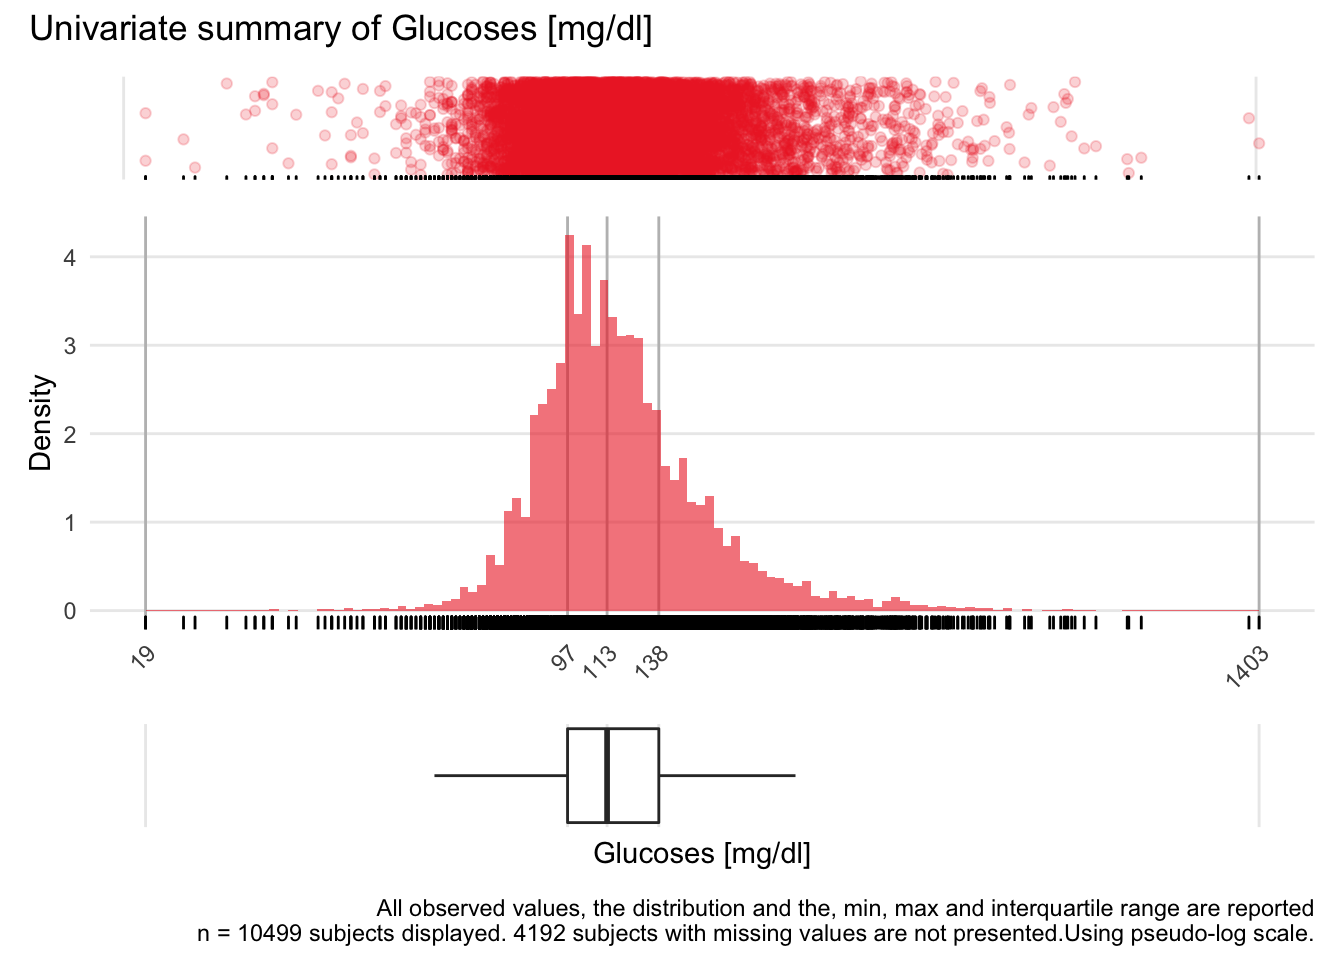
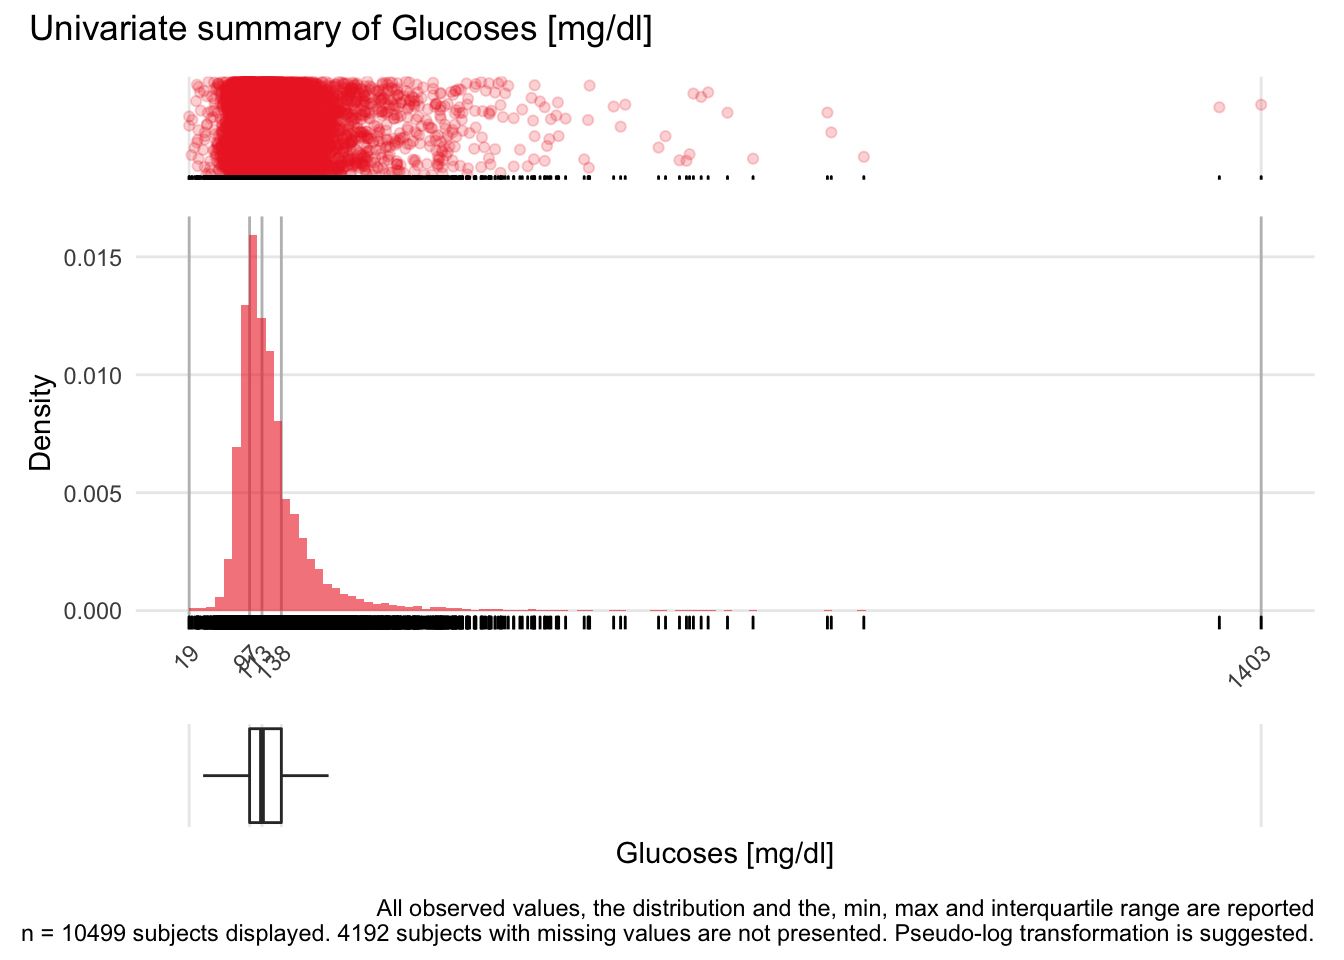
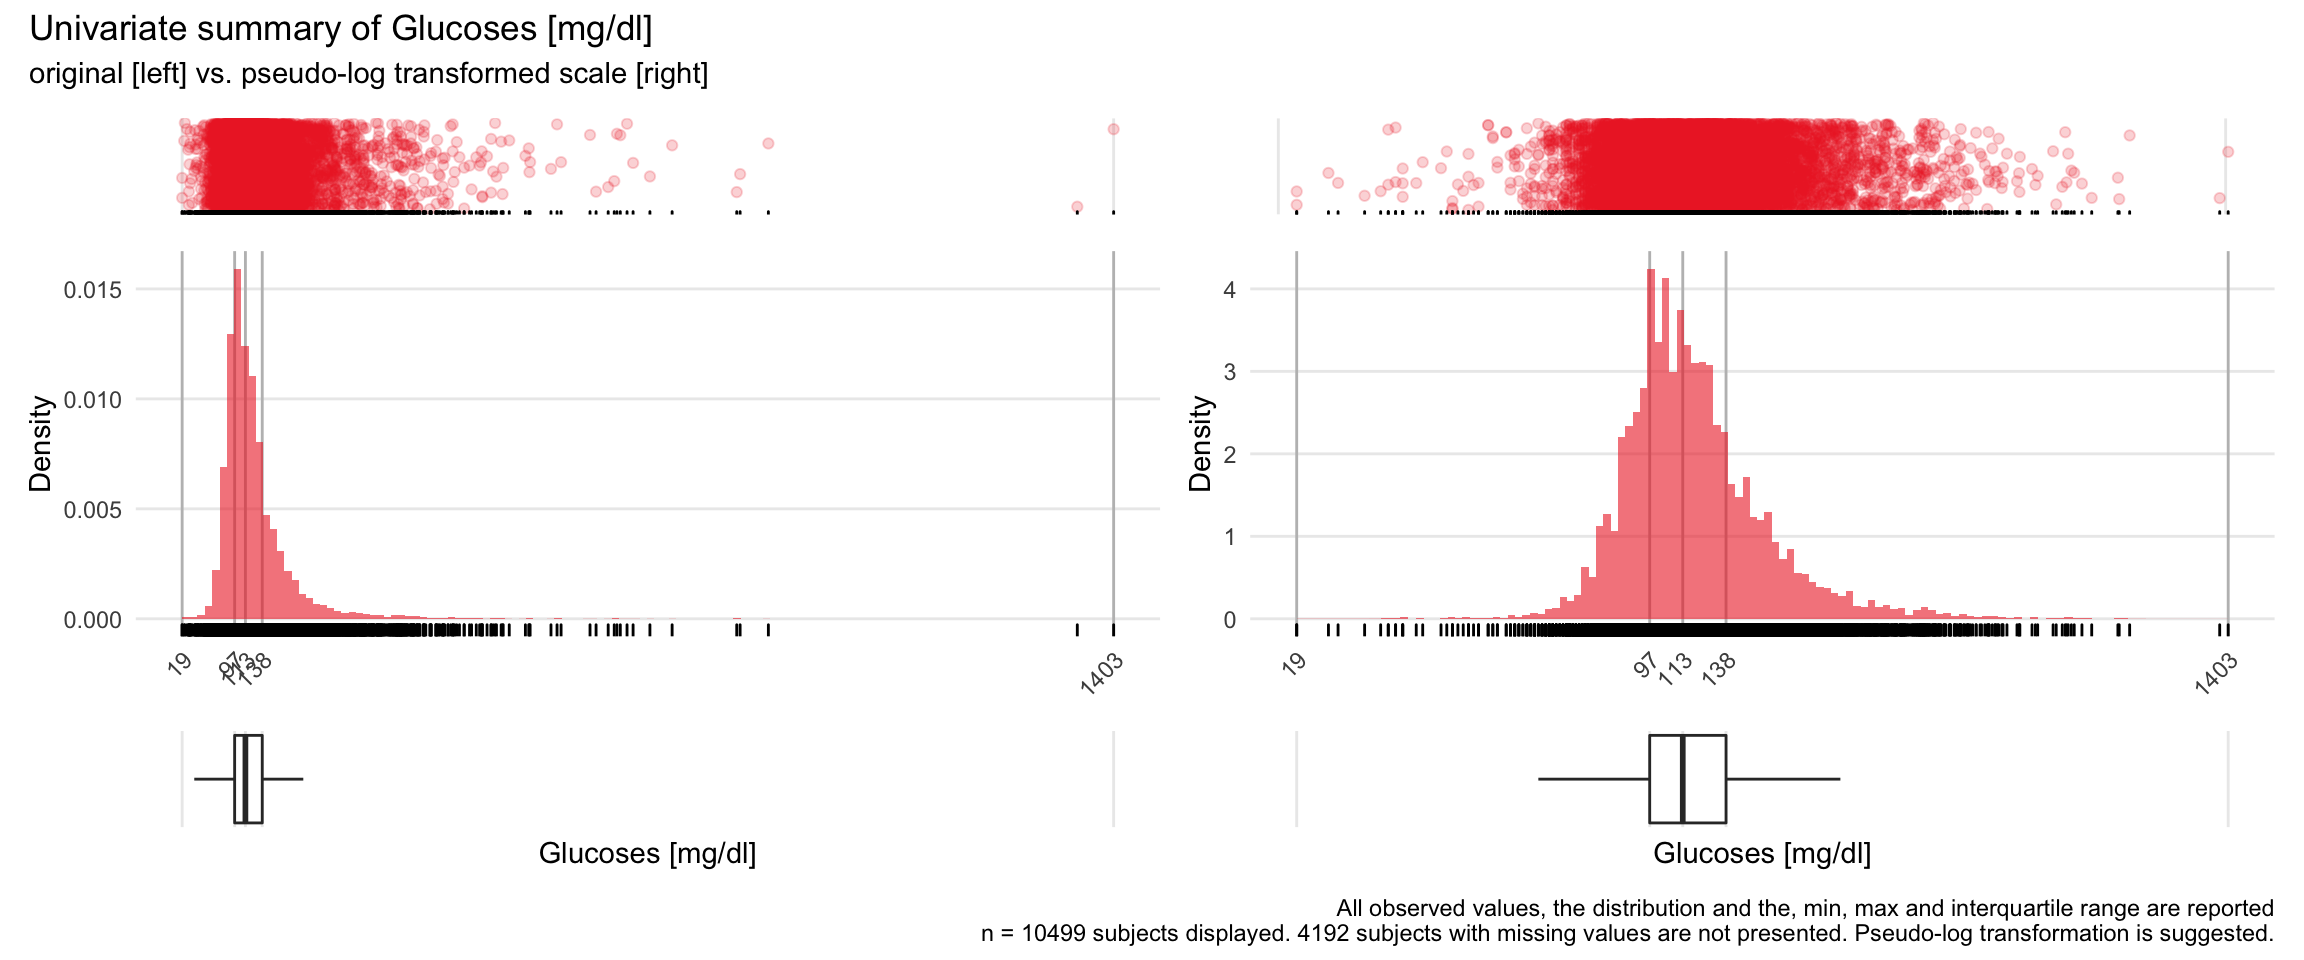
GLU: Glucoses mg/dl

| n | missing | distinct | Info | Mean | Gmd | .05 | .10 | .25 | .50 | .75 | .90 | .95 |
|---|---|---|---|---|---|---|---|---|---|---|---|---|
| 10499 | 4192 | 389 | 1 | 126.4 | 48.3 | 78 | 85 | 97 | 113 | 138 | 177 | 216 |
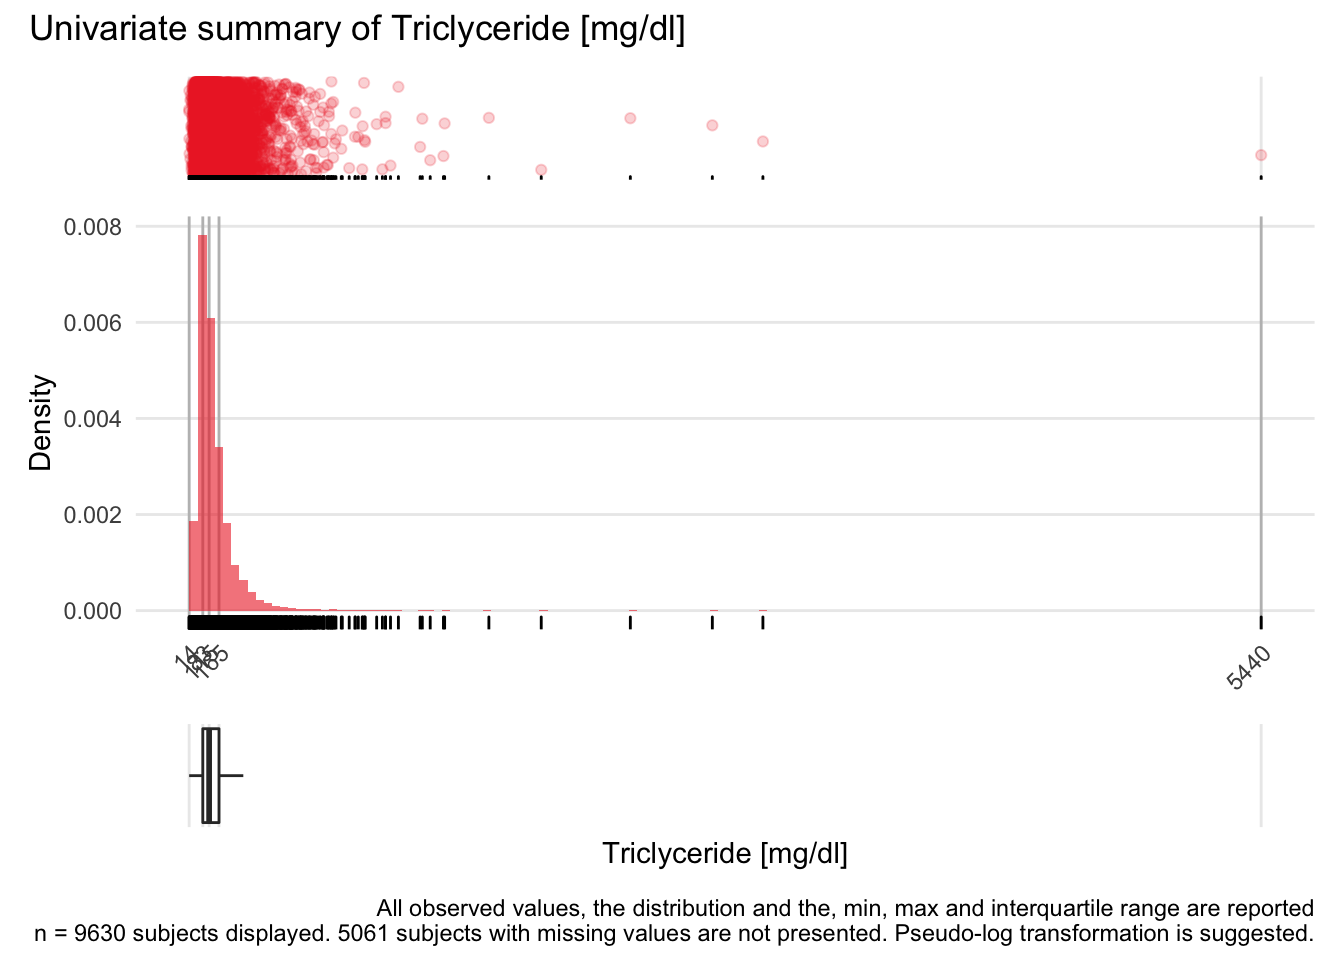
TRIG: Triclyceride mg/dl

| n | missing | distinct | Info | Mean | Gmd | .05 | .10 | .25 | .50 | .75 | .90 | .95 |
|---|---|---|---|---|---|---|---|---|---|---|---|---|
| 9630 | 5061 | 538 | 1 | 141.7 | 90.33 | 54 | 64 | 83 | 115 | 165 | 241 | 307 |
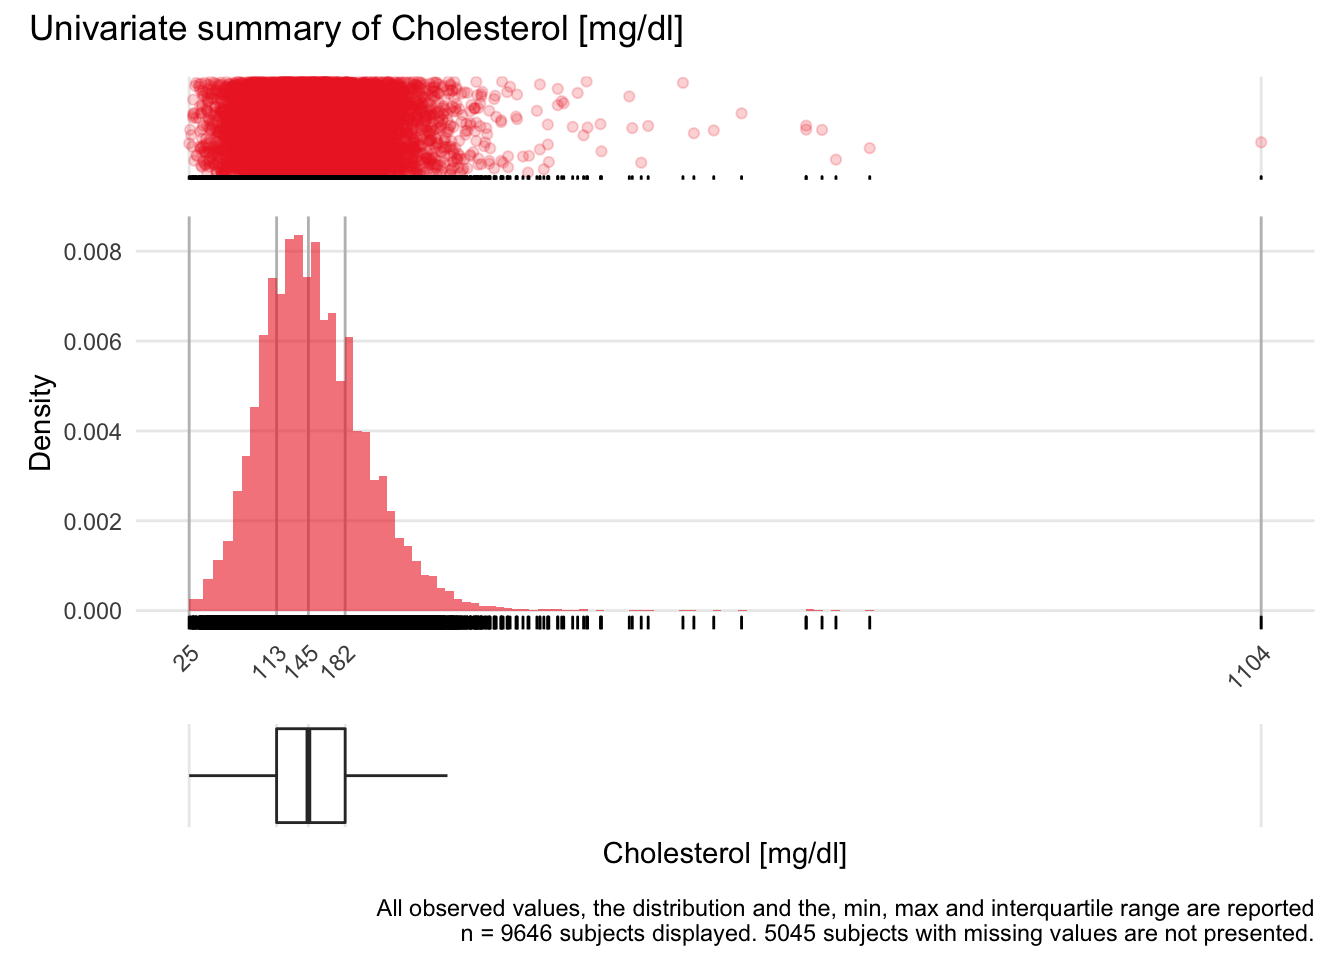
CHOL: Cholesterol mg/dl

| n | missing | distinct | Info | Mean | Gmd | .05 | .10 | .25 | .50 | .75 | .90 | .95 |
|---|---|---|---|---|---|---|---|---|---|---|---|---|
| 9646 | 5045 | 339 | 1 | 150.8 | 59.23 | 74 | 89 | 113 | 145 | 182 | 219 | 243 |
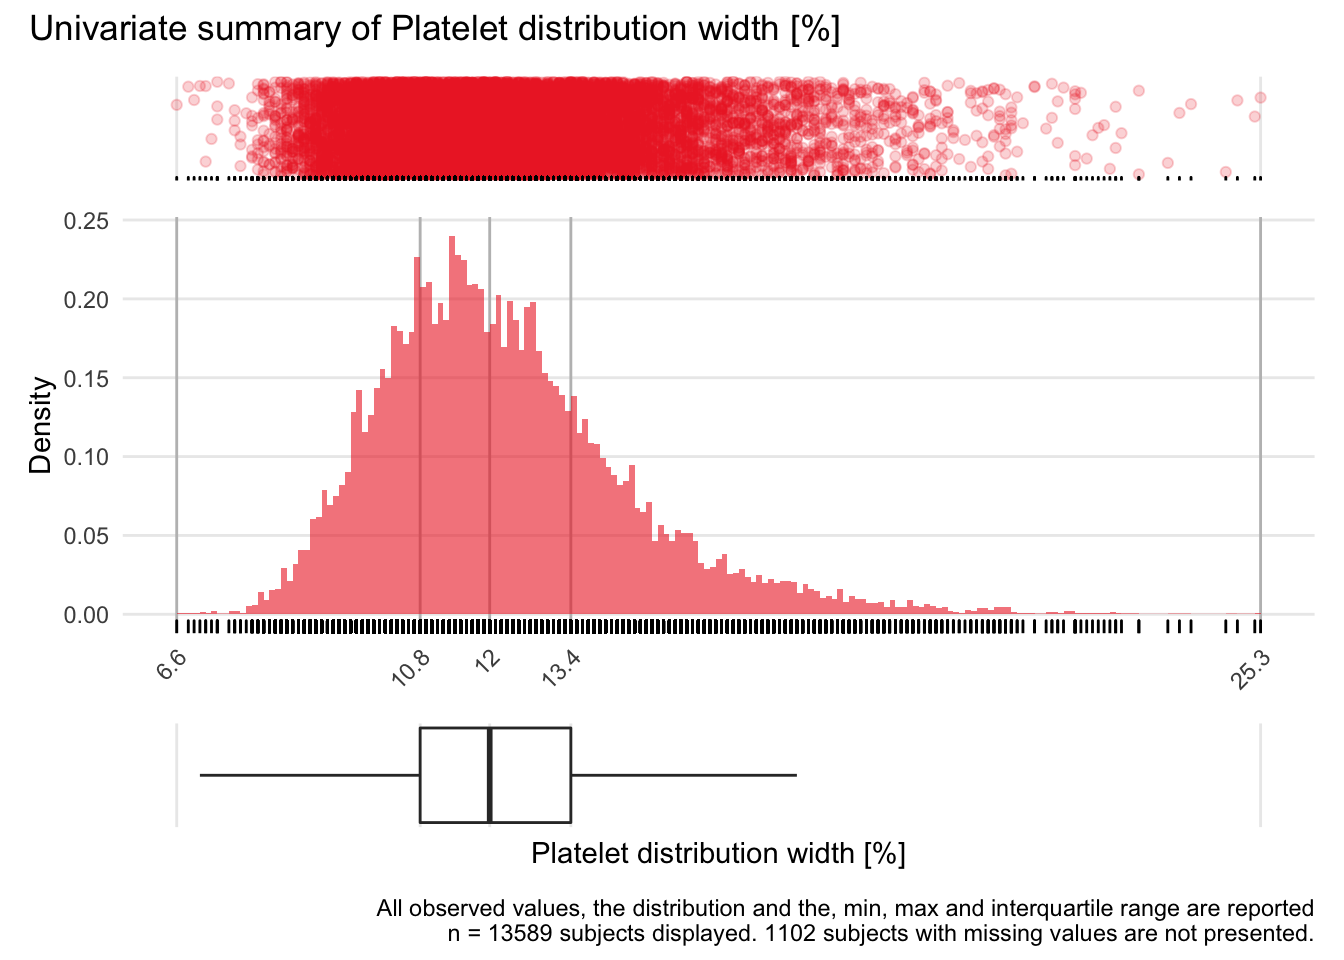
PDW: Platelet distribution width %

| n | missing | distinct | Info | Mean | Gmd | .05 | .10 | .25 | .50 | .75 | .90 | .95 |
|---|---|---|---|---|---|---|---|---|---|---|---|---|
| 13589 | 1102 | 167 | 1 | 12.29 | 2.375 | 9.3 | 9.8 | 10.8 | 12.0 | 13.4 | 15.1 | 16.4 |
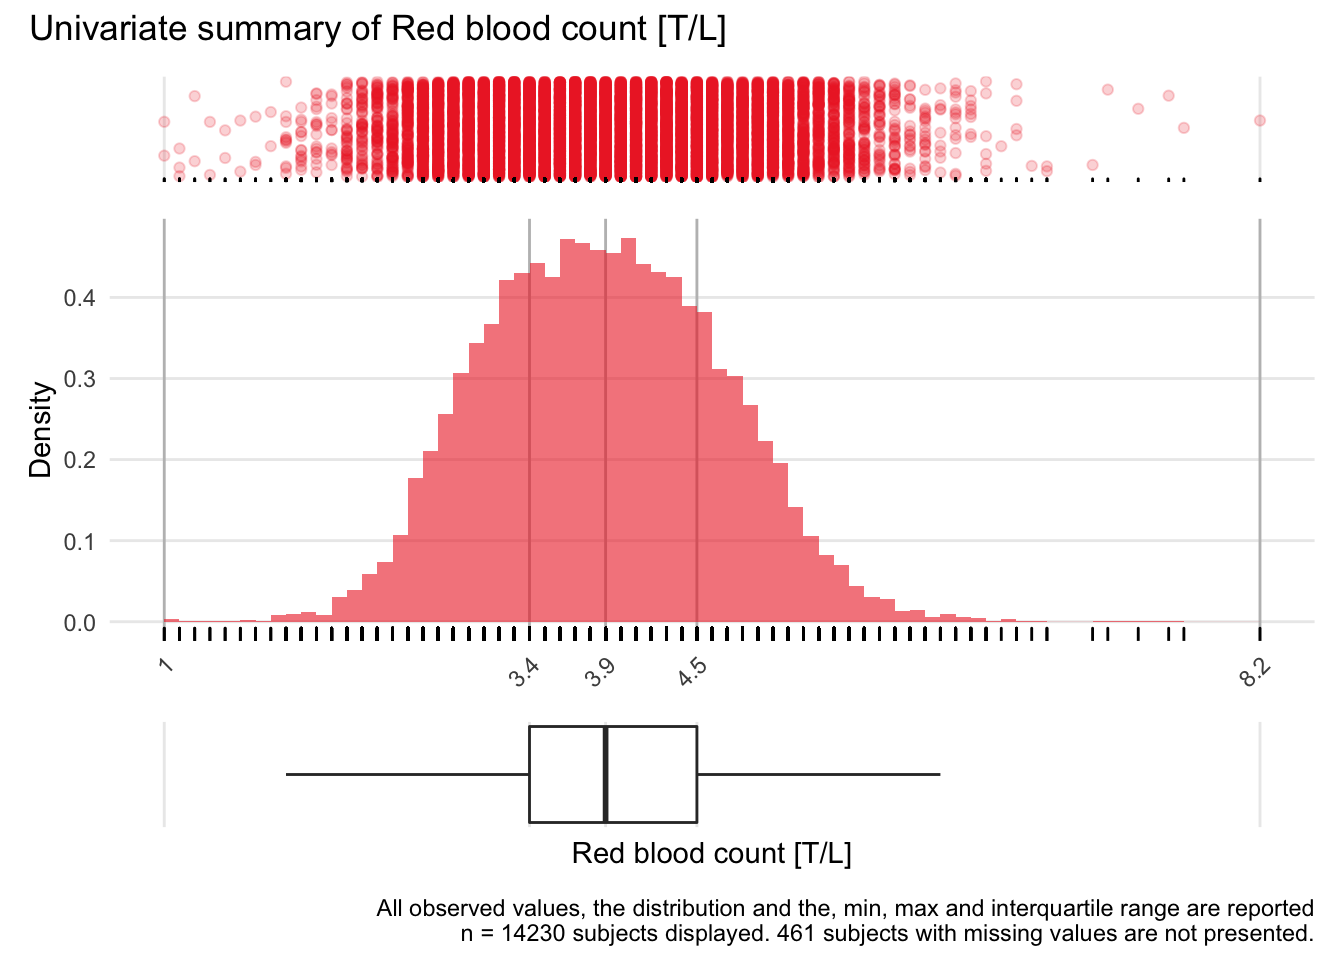
RBC: Red blood count T/L

| n | missing | distinct | Info | Mean | Gmd | .05 | .10 | .25 | .50 | .75 | .90 | .95 |
|---|---|---|---|---|---|---|---|---|---|---|---|---|
| 14230 | 461 | 65 | 0.999 | 3.936 | 0.8772 | 2.7 | 2.9 | 3.4 | 3.9 | 4.5 | 4.9 | 5.2 |
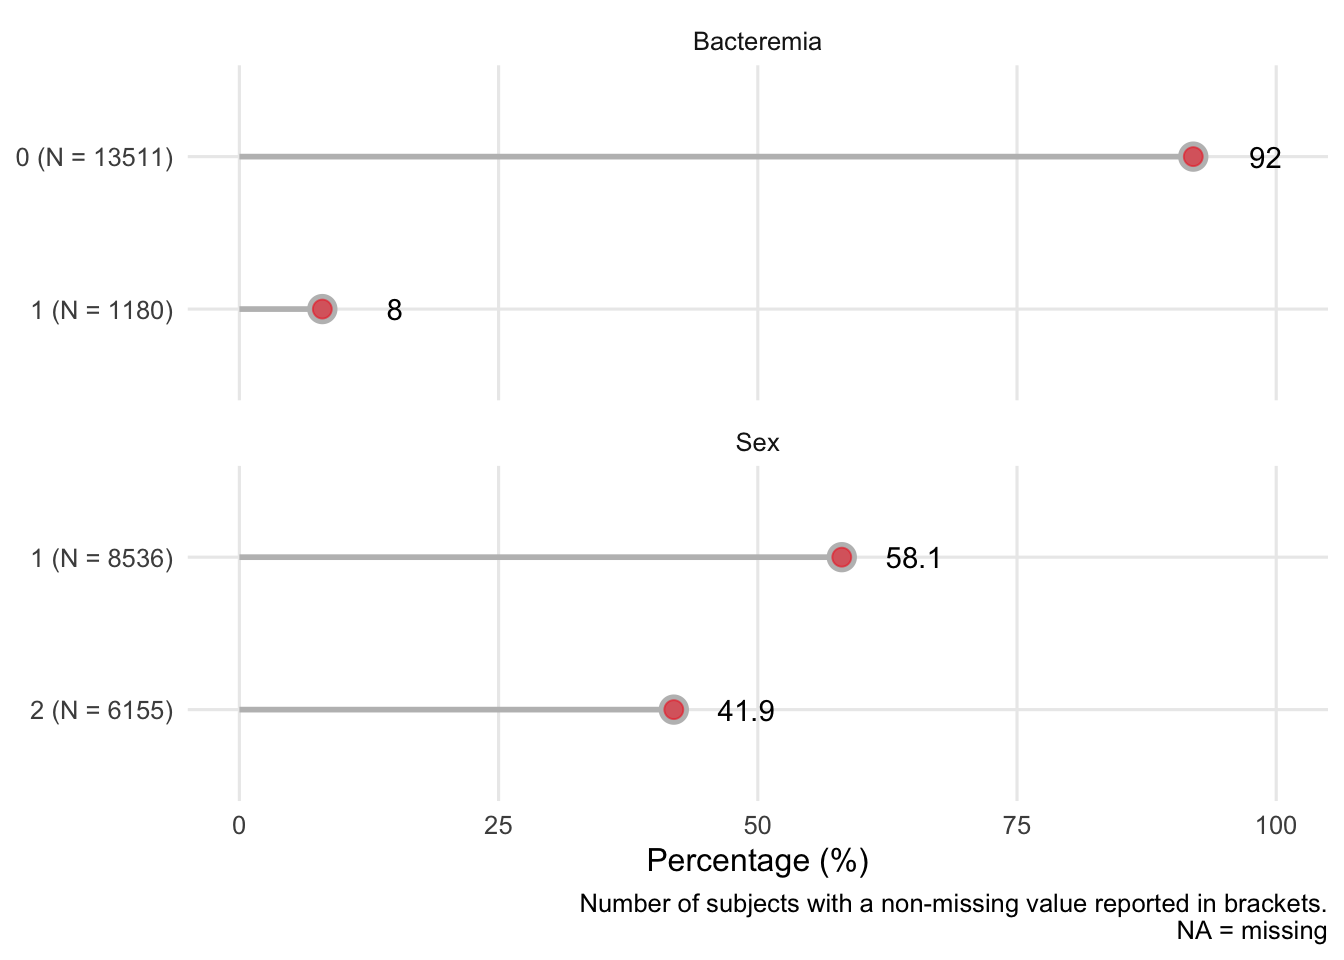
8.2 Categorical variables
We now provide a closer visual examination of the categorical predictors.
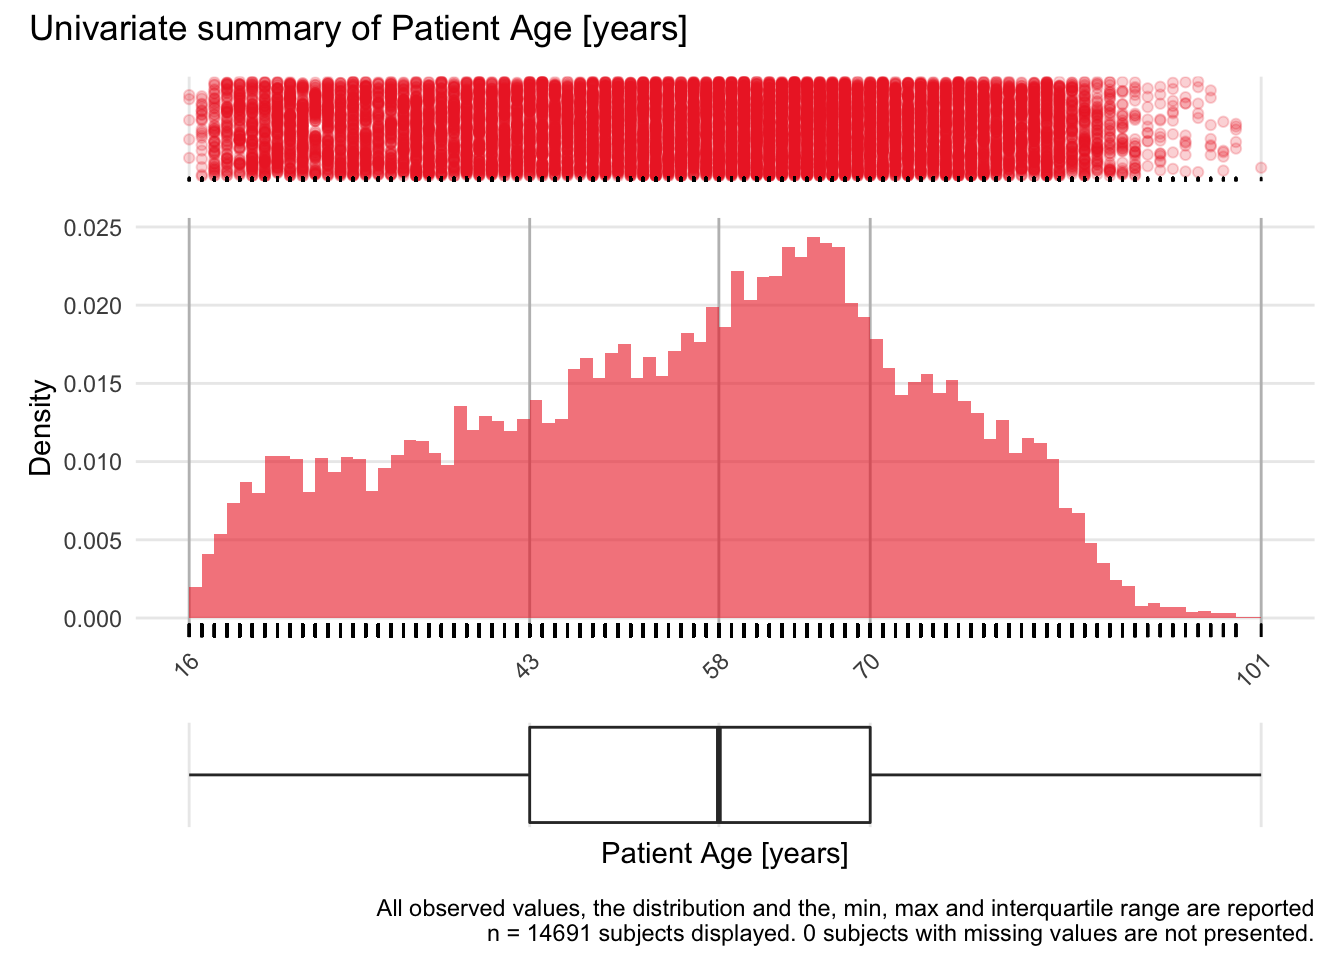
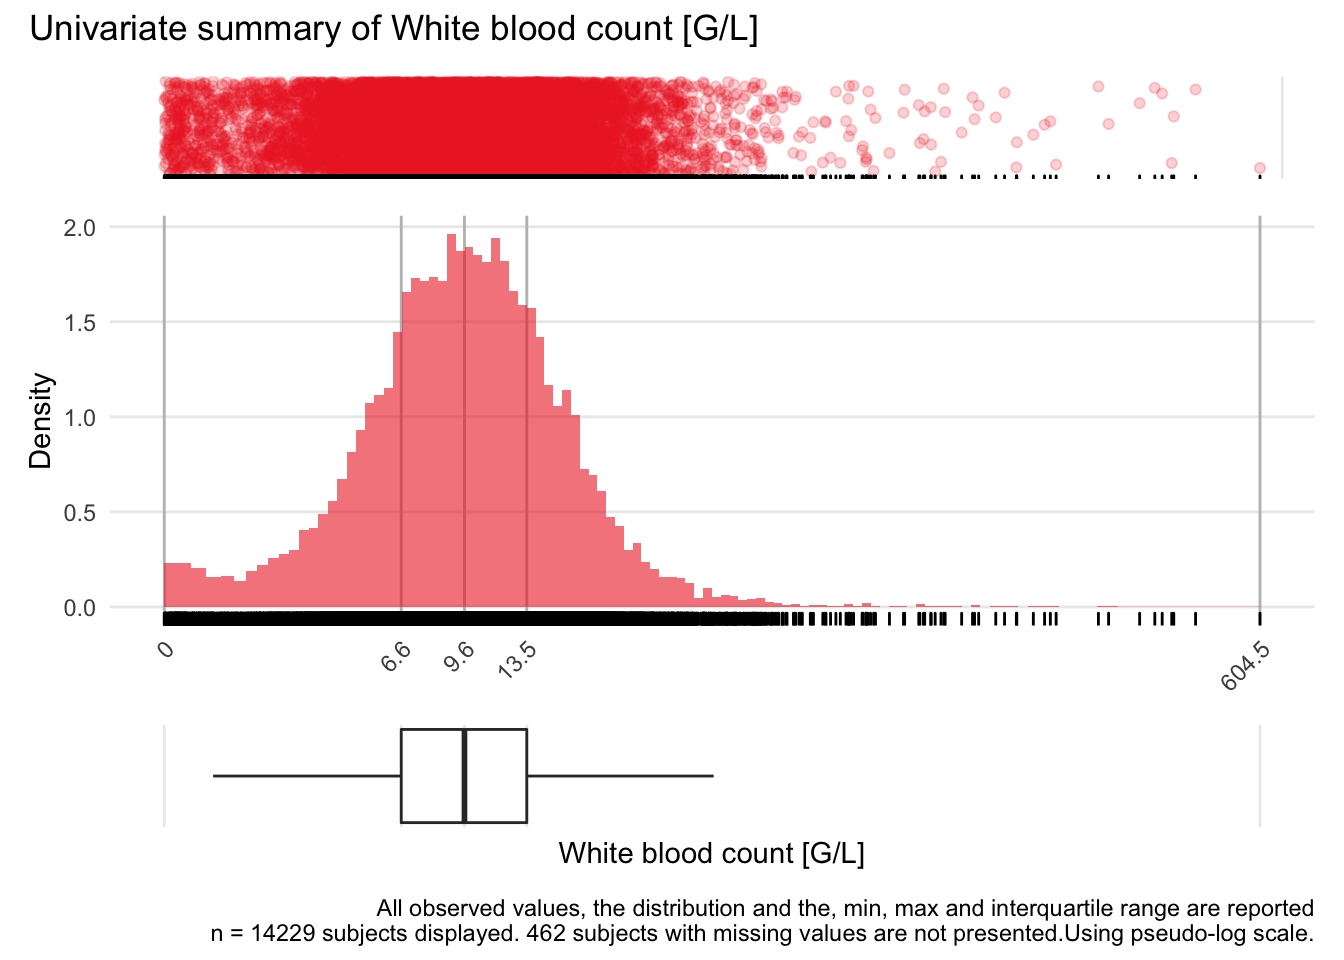
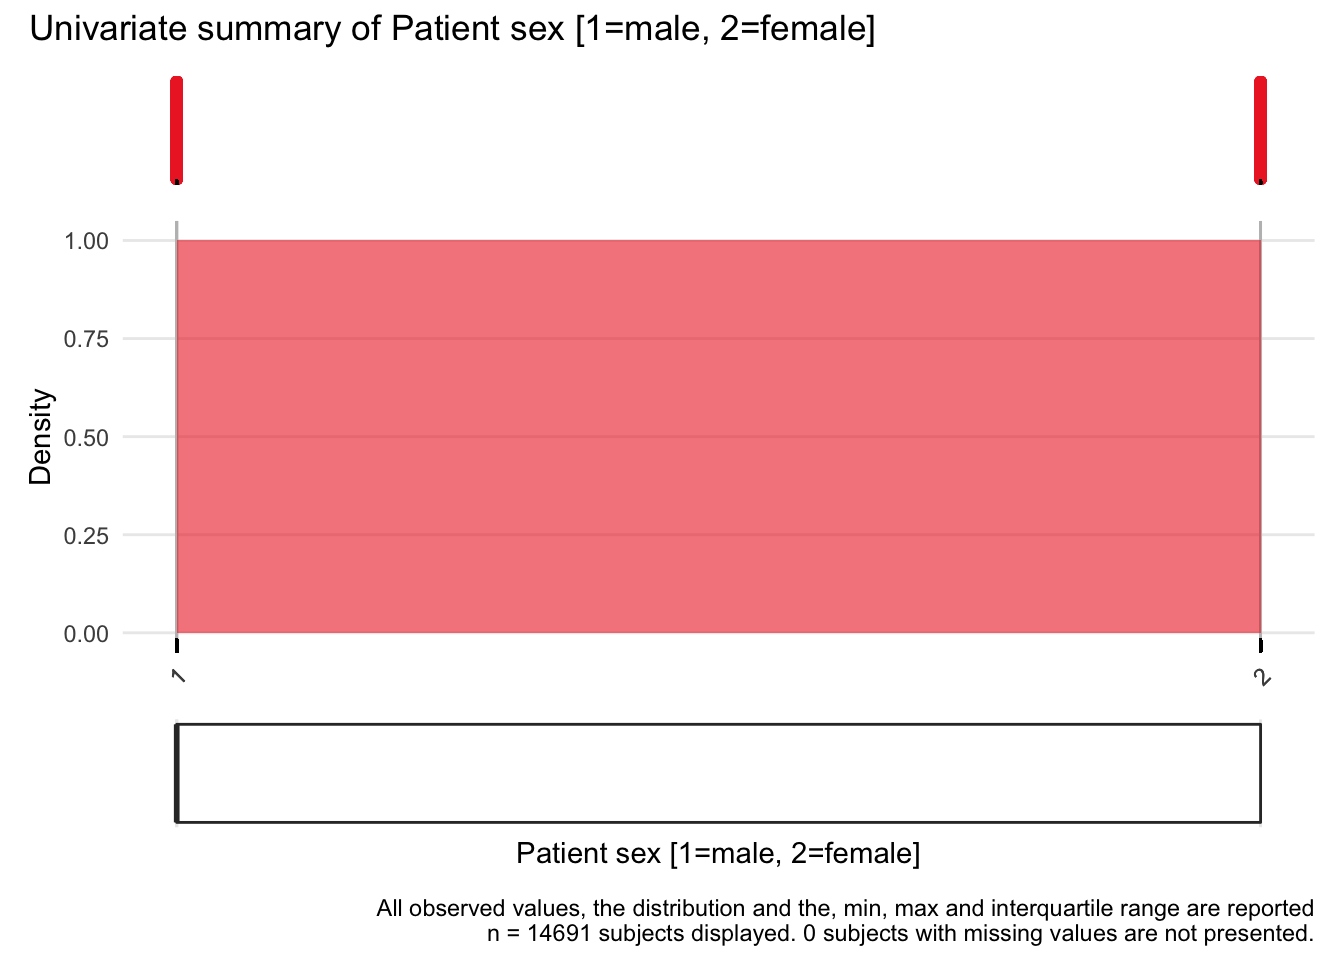
8.3 Continuous variables
8.3.1 Suggested transformations
Next we investigate whether a transformation of continuous variables may improve any further analyses to reduce disproportional impact of highly influential points, also in multivariate summaries. We employ a function ida_trans for this purpose, which optimises the parameter sigma of the pseudo-logarithm for that purpose. The optimization targets the best possible linear correlation of the transformed values with normal deviates. If no better transformation can be found, no transformation is suggested.
Show the code
variables<- c("AGE", structural_vars, key_predictors, leuko_related_vars, leuko_ratio_vars, kidney_related_vars, acute_related_vars, remaining_vars)
unique.variables <- unique(variables)

res<-sapply(unique.variables, function(X) ida_trans(b_bact[,X])$const) #takes long, calculate once, and save?

res
AGE WBC SEX BUN CREA NEU PLT
NA 2.14364604 NA 0.03198339 0.03193846 NA NA
EOS BASO LYM MONO NEUR EOSR BASOR
0.12561255 0.13215999 0.17979933 0.23679427 NA 0.47139320 0.19315481
LYMR MONOR POTASS eGFR BUN_CREA FIB CRP
1.70910135 3.11197362 NA NA 0.01953382 NA NA
ASAT ALAT GGT MCV HGB HCT MCH
0.02818736 1.01761807 0.02827878 NA NA NA NA
MCHC RDW MPV NT APTT SODIUM CA
NA NA NA NA 0.03047767 NA NA
PHOS MG HS GBIL TP ALB AMY
0.12526560 NA NA 0.03306450 NA NA 0.01844397
PAMY LIP CHE AP LDH CK GLU
0.03036179 1.02765958 NA 0.02384583 0.03166182 0.03282045 0.02766430
TRIG CHOL PDW RBC
0.03242708 NA NA NA Register transformed variables in the data set:
Show the code
for(j in 1:length(unique.variables)){
  if(!is.na(res[j])){
    newname <- paste("t_",unique.variables[j],sep="")
    newlabel <- paste("pseudo-log of",label(b_bact)[unique.variables[j]])
    names(newlabel)<-newname
    x<-pseudo_log(b_bact[[unique.variables[j]]], sigma=res[j], base=10)
    label(x)<-newlabel
    b_bact[[newname]] <- x
    upData(b_bact, labels=newlabel)
  }
}
Input object size: 5575040 bytes; 57 variables 14691 observations
New object size: 5574816 bytes; 57 variables 14691 observations
Input object size: 5693696 bytes; 58 variables 14691 observations
New object size: 5693472 bytes; 58 variables 14691 observations
Input object size: 5812336 bytes; 59 variables 14691 observations
New object size: 5812112 bytes; 59 variables 14691 observations
Input object size: 5930976 bytes; 60 variables 14691 observations
New object size: 5930752 bytes; 60 variables 14691 observations
Input object size: 6049616 bytes; 61 variables 14691 observations
New object size: 6049392 bytes; 61 variables 14691 observations
Input object size: 6168256 bytes; 62 variables 14691 observations
New object size: 6168032 bytes; 62 variables 14691 observations
Input object size: 6286896 bytes; 63 variables 14691 observations
New object size: 6286672 bytes; 63 variables 14691 observations
Input object size: 6405536 bytes; 64 variables 14691 observations
New object size: 6405312 bytes; 64 variables 14691 observations
Input object size: 6524176 bytes; 65 variables 14691 observations
New object size: 6523952 bytes; 65 variables 14691 observations
Input object size: 6642824 bytes; 66 variables 14691 observations
New object size: 6642600 bytes; 66 variables 14691 observations
Input object size: 6761464 bytes; 67 variables 14691 observations
New object size: 6761240 bytes; 67 variables 14691 observations
Input object size: 6880128 bytes; 68 variables 14691 observations
New object size: 6879896 bytes; 68 variables 14691 observations
Input object size: 6998784 bytes; 69 variables 14691 observations
New object size: 6998560 bytes; 69 variables 14691 observations
Input object size: 7117440 bytes; 70 variables 14691 observations
New object size: 7117216 bytes; 70 variables 14691 observations
Input object size: 7236096 bytes; 71 variables 14691 observations
New object size: 7235872 bytes; 71 variables 14691 observations
Input object size: 7354768 bytes; 72 variables 14691 observations
New object size: 7354544 bytes; 72 variables 14691 observations
Input object size: 7473408 bytes; 73 variables 14691 observations
New object size: 7473184 bytes; 73 variables 14691 observations
Input object size: 7592048 bytes; 74 variables 14691 observations
New object size: 7591824 bytes; 74 variables 14691 observations
Input object size: 7710688 bytes; 75 variables 14691 observations
New object size: 7710464 bytes; 75 variables 14691 observations
Input object size: 7829328 bytes; 76 variables 14691 observations
New object size: 7829104 bytes; 76 variables 14691 observations
Input object size: 7947968 bytes; 77 variables 14691 observations
New object size: 7947744 bytes; 77 variables 14691 observations
Input object size: 8066624 bytes; 78 variables 14691 observations
New object size: 8066400 bytes; 78 variables 14691 observations
Input object size: 8185280 bytes; 79 variables 14691 observations
New object size: 8185056 bytes; 79 variables 14691 observations
Input object size: 8303936 bytes; 80 variables 14691 observations
New object size: 8303712 bytes; 80 variables 14691 observations
Input object size: 8422576 bytes; 81 variables 14691 observations
New object size: 8422352 bytes; 81 variables 14691 observations
Input object size: 8541216 bytes; 82 variables 14691 observations
New object size: 8540992 bytes; 82 variables 14691 observationsShow the code
sigma_values <- res


c_bact <- b_bact

# update variable lists - generate a second list with transformed variables replacing the originals

bact_transformed <- bact_variables

for(j in 1:length(bact_variables)){
  for(jj in 1:length(bact_variables[[j]])){
      if(!is.na(res[bact_variables[[j]][jj]])) bact_transformed[[j]][jj] <- paste("t_", bact_variables[[j]][jj], sep="")
  }
}
8.3.2 Univariate distribution with variables using the original variable and the suggested transformations
Show the code
for(j in 1:length(unique.variables)){
  print(ida_plot_univar(b_bact, unique.variables[j], sigma=res[j], n_bars=100))
#  if(!is.na(res[j])){
#    print(ida_plot_univar(b_bact, paste("t_",variables[j],sep="")))
#  }
}
Warning: Removed 1 rows containing missing values (geom_bar).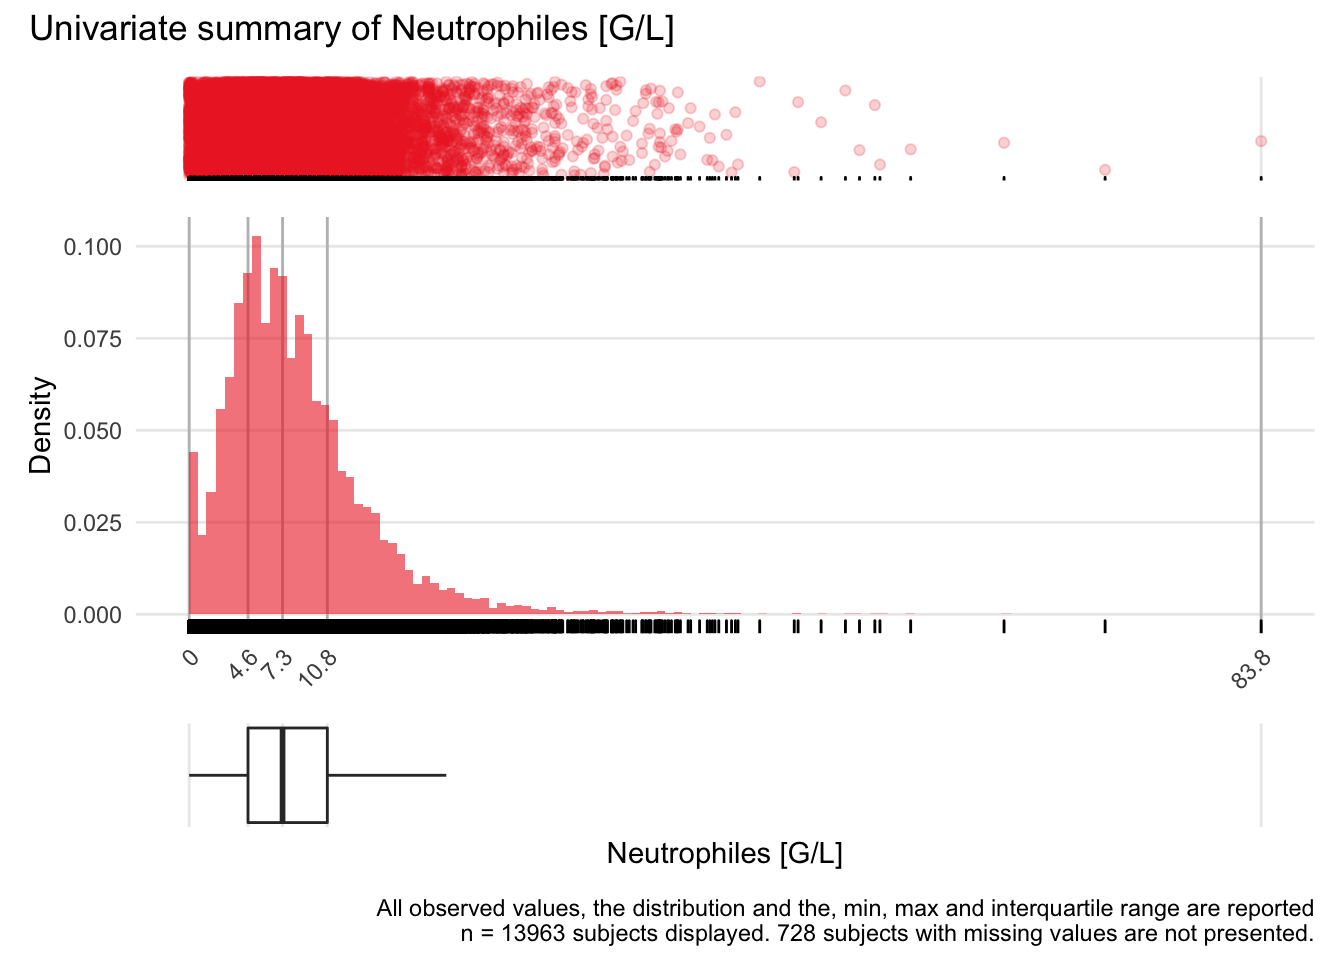


Warning: Removed 1 rows containing missing values (geom_bar).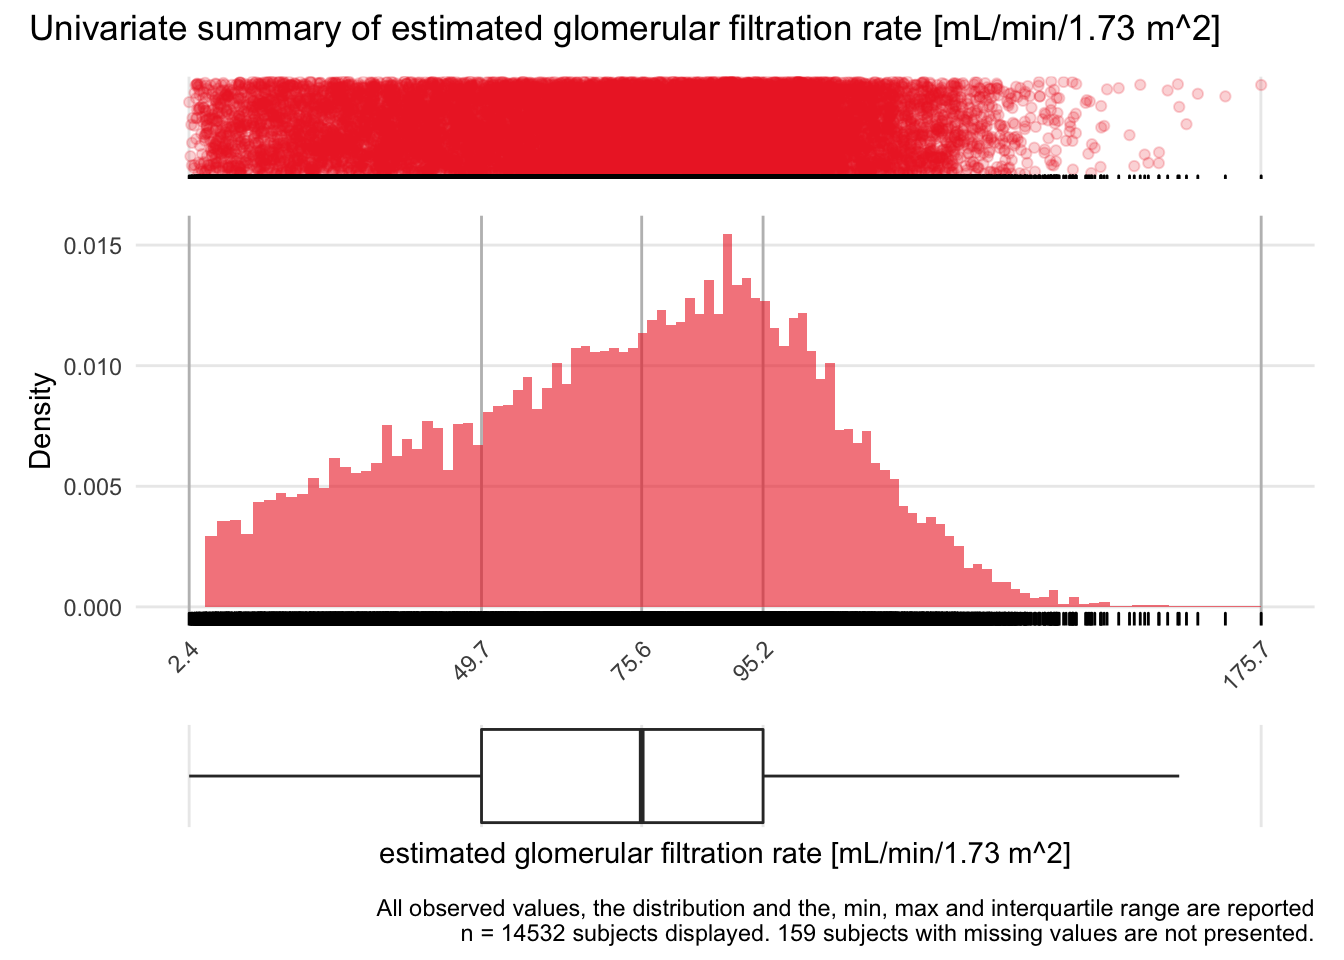


Warning: Removed 1 rows containing missing values (geom_bar).
Warning: Removed 1 rows containing missing values (geom_bar).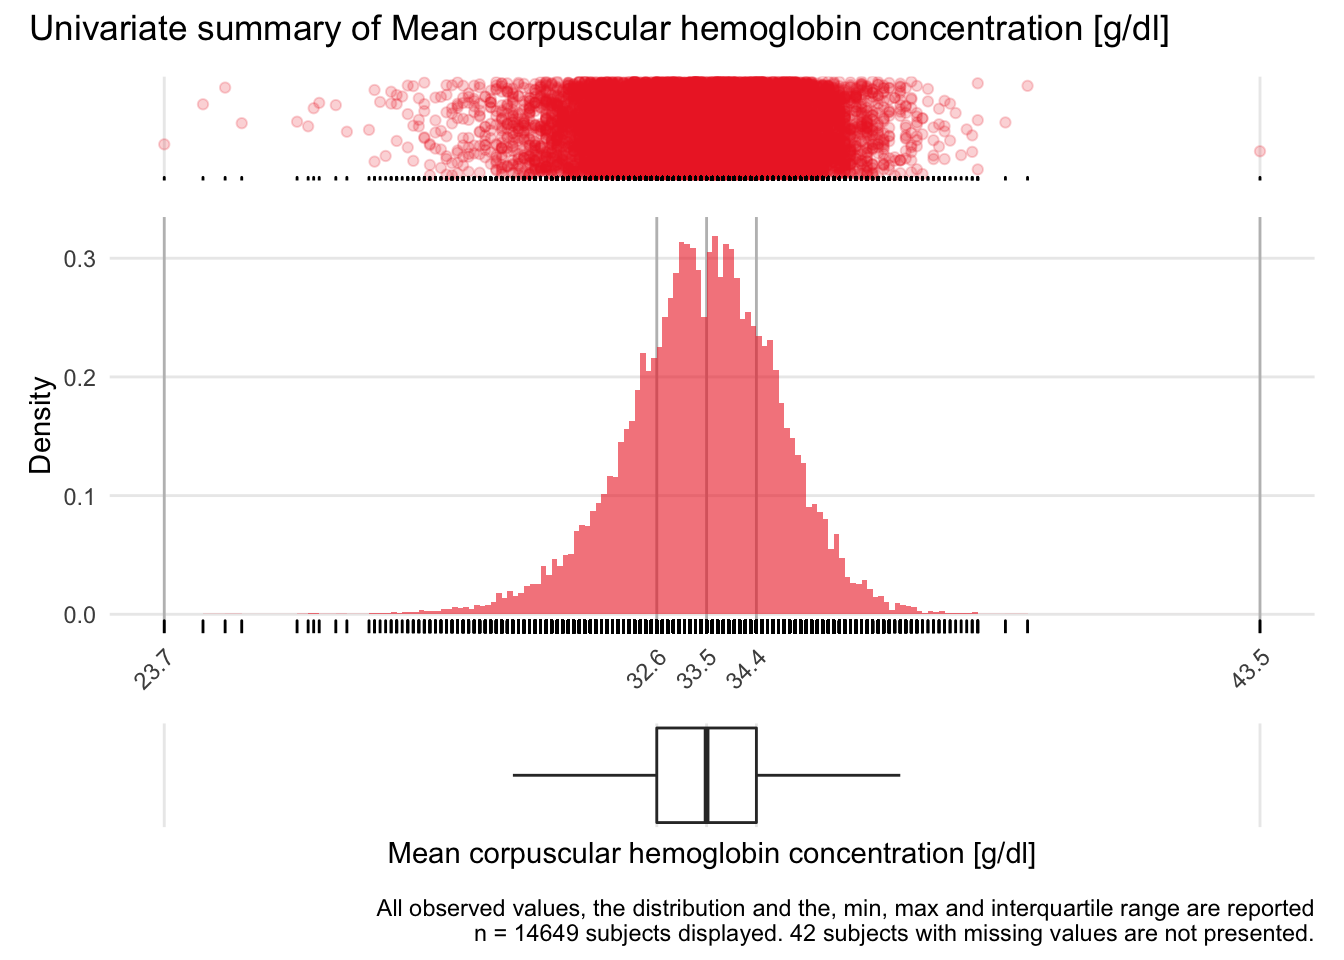


Warning: Removed 1 rows containing missing values (geom_bar).
Warning: Removed 1 rows containing missing values (geom_bar).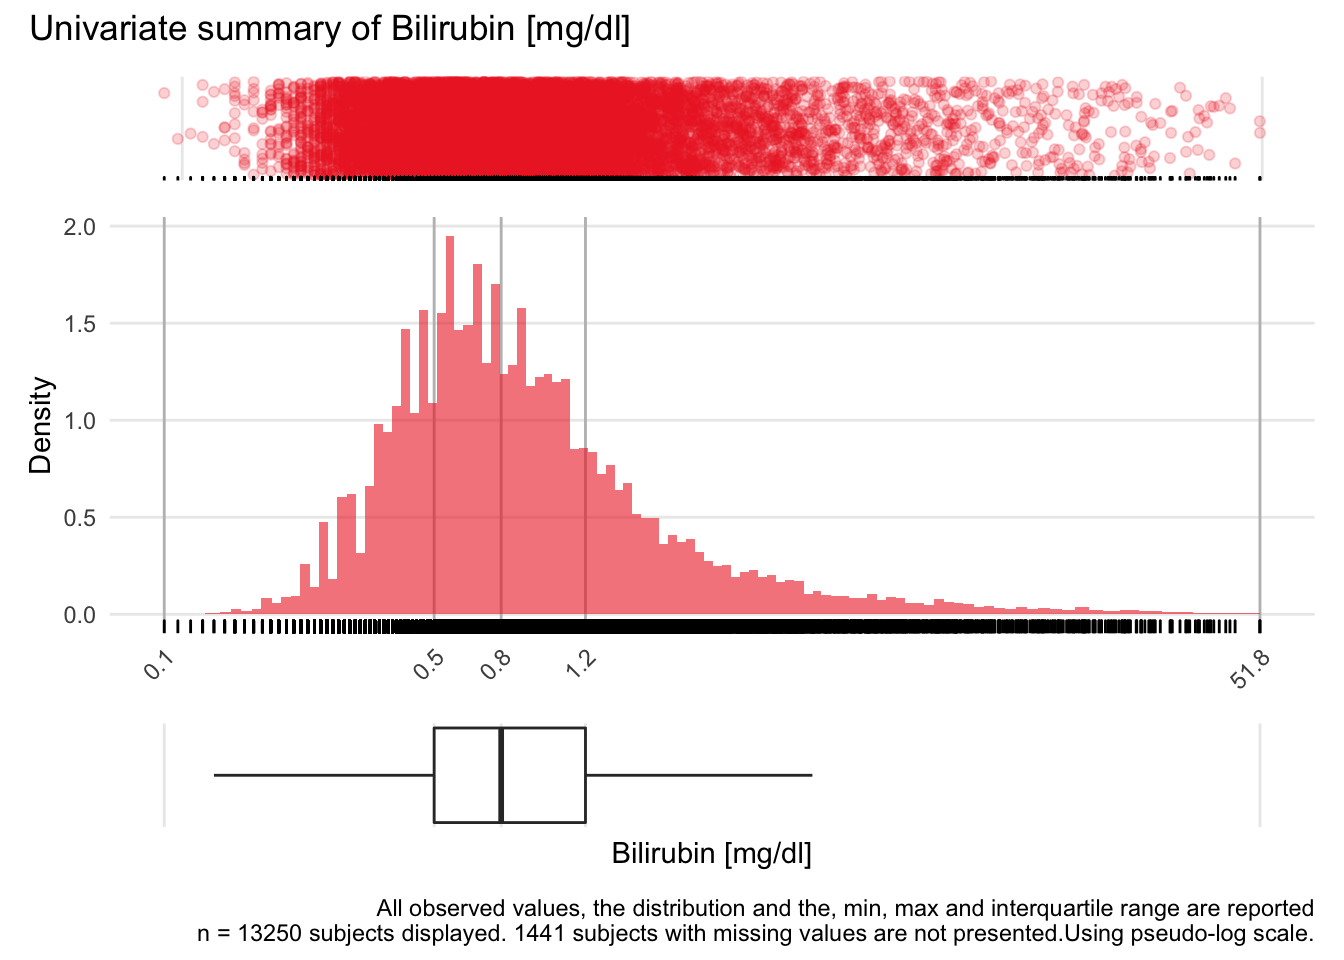
Warning: Removed 1 rows containing missing values (geom_bar).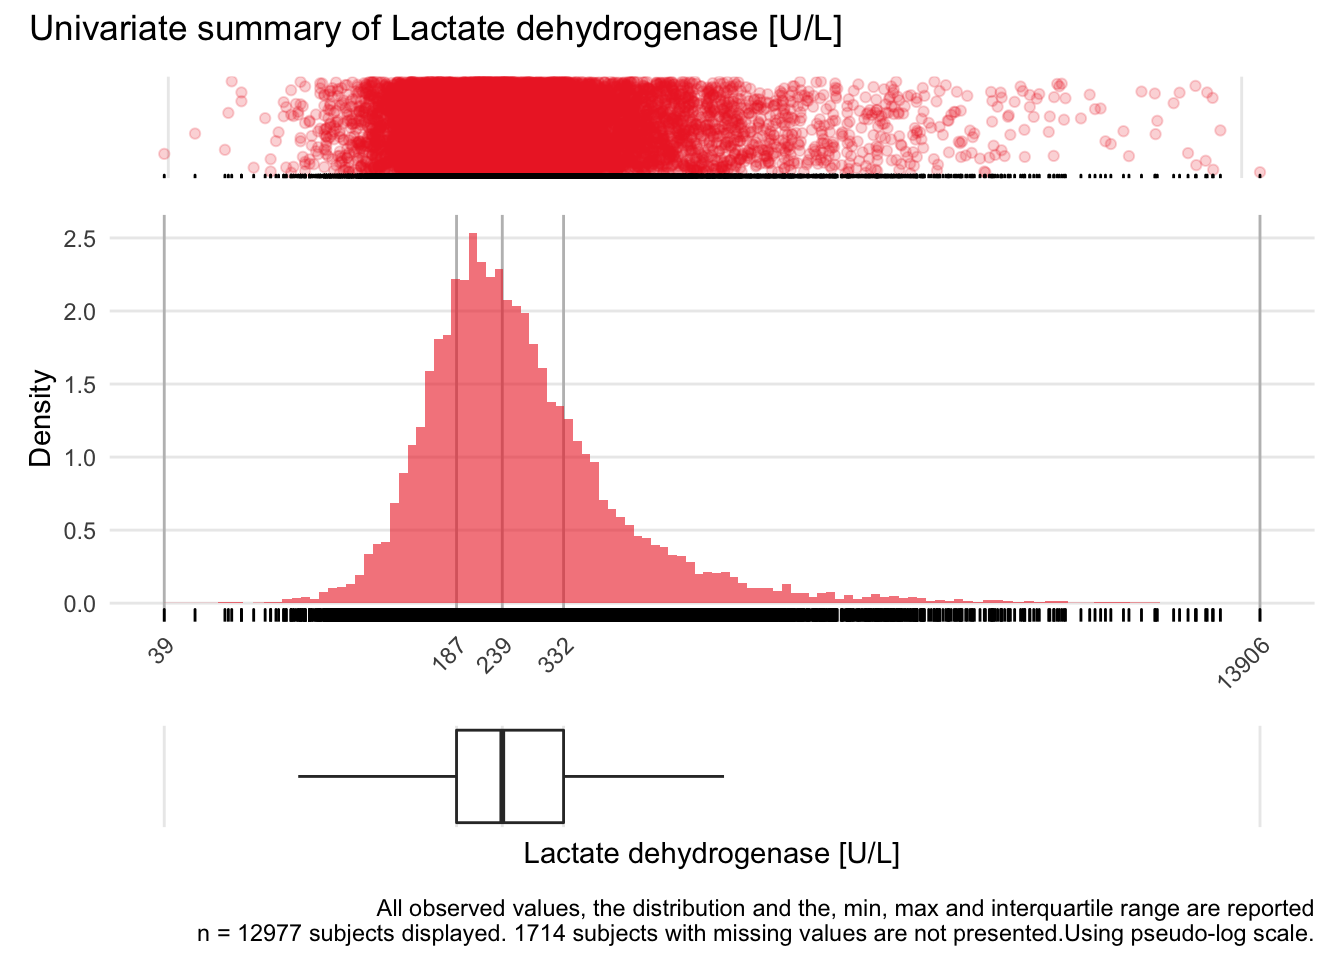
Warning: Removed 1 rows containing missing values (geom_bar).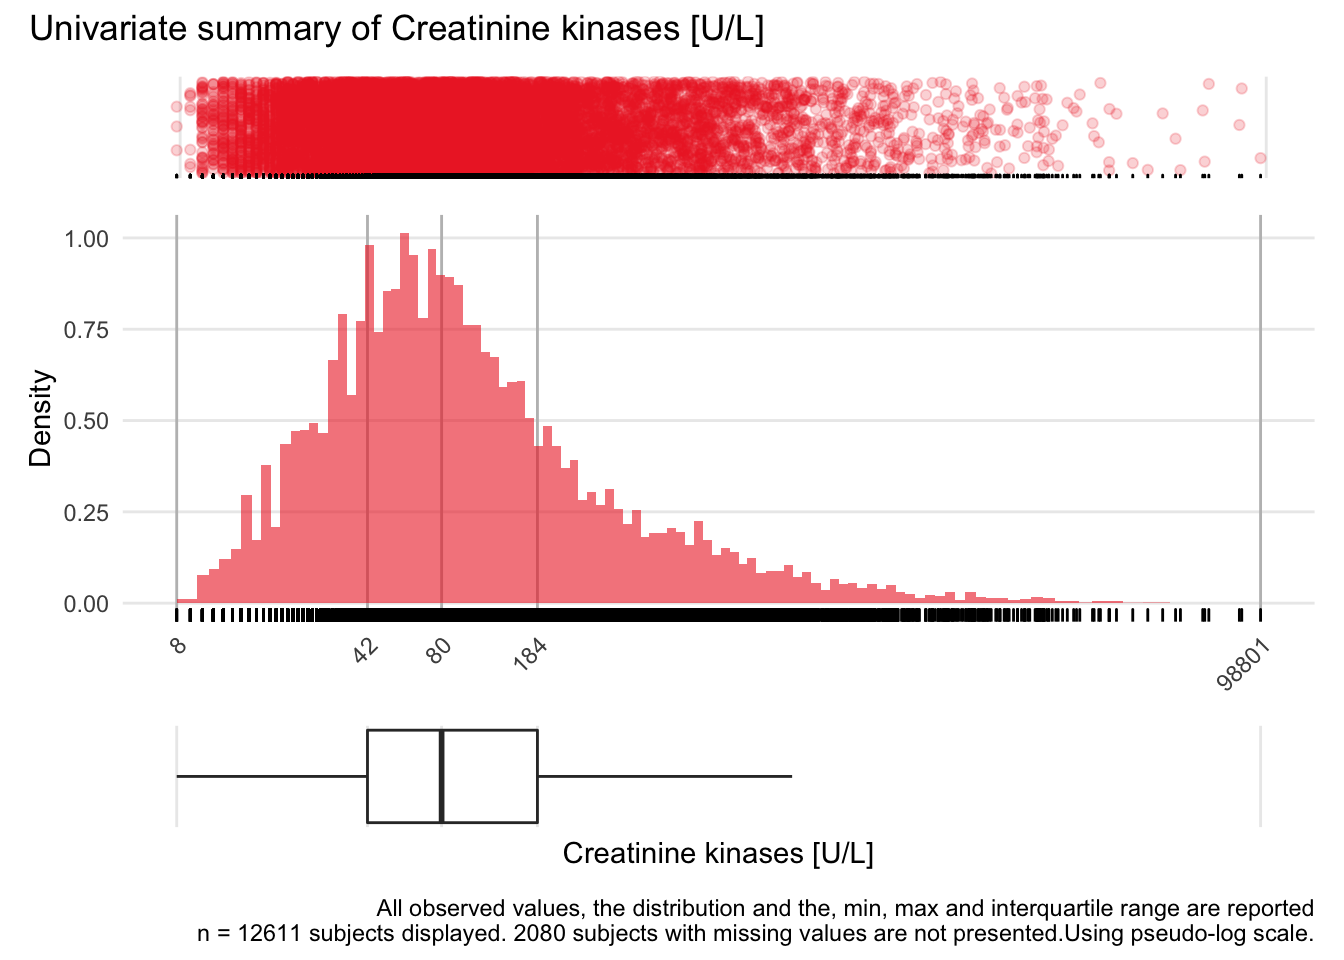
Warning: Removed 1 rows containing missing values (geom_bar).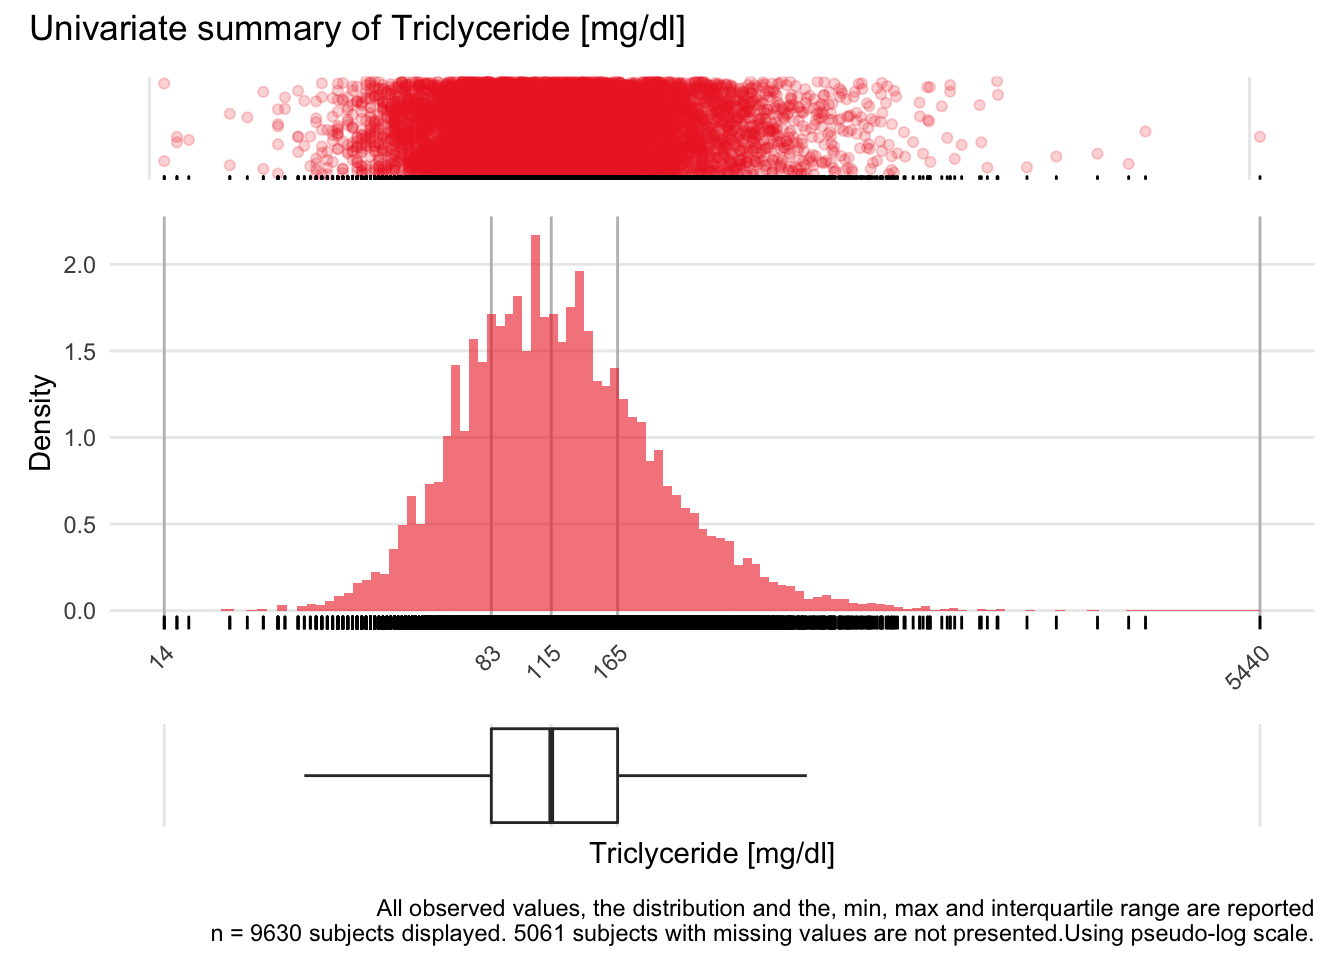

8.3.3 Comparison of univariate distributions with and without pseudo-log transformation
The comparison is only shown for variables where a transformation is suggested.
Show the code
for(j in 1:length(unique.variables)){
#  print(ida_plot_univar_orig_vs_trans(b_bact, unique.variables[j], sigma=res[j], n_bars=100))
 if(!is.na(res[j])){
   print(ida_plot_univar_orig_vs_trans(b_bact, unique.variables[j], sigma=res[j], n_bars=100))
 }
}


Warning: Removed 1 rows containing missing values (geom_bar).
Removed 1 rows containing missing values (geom_bar).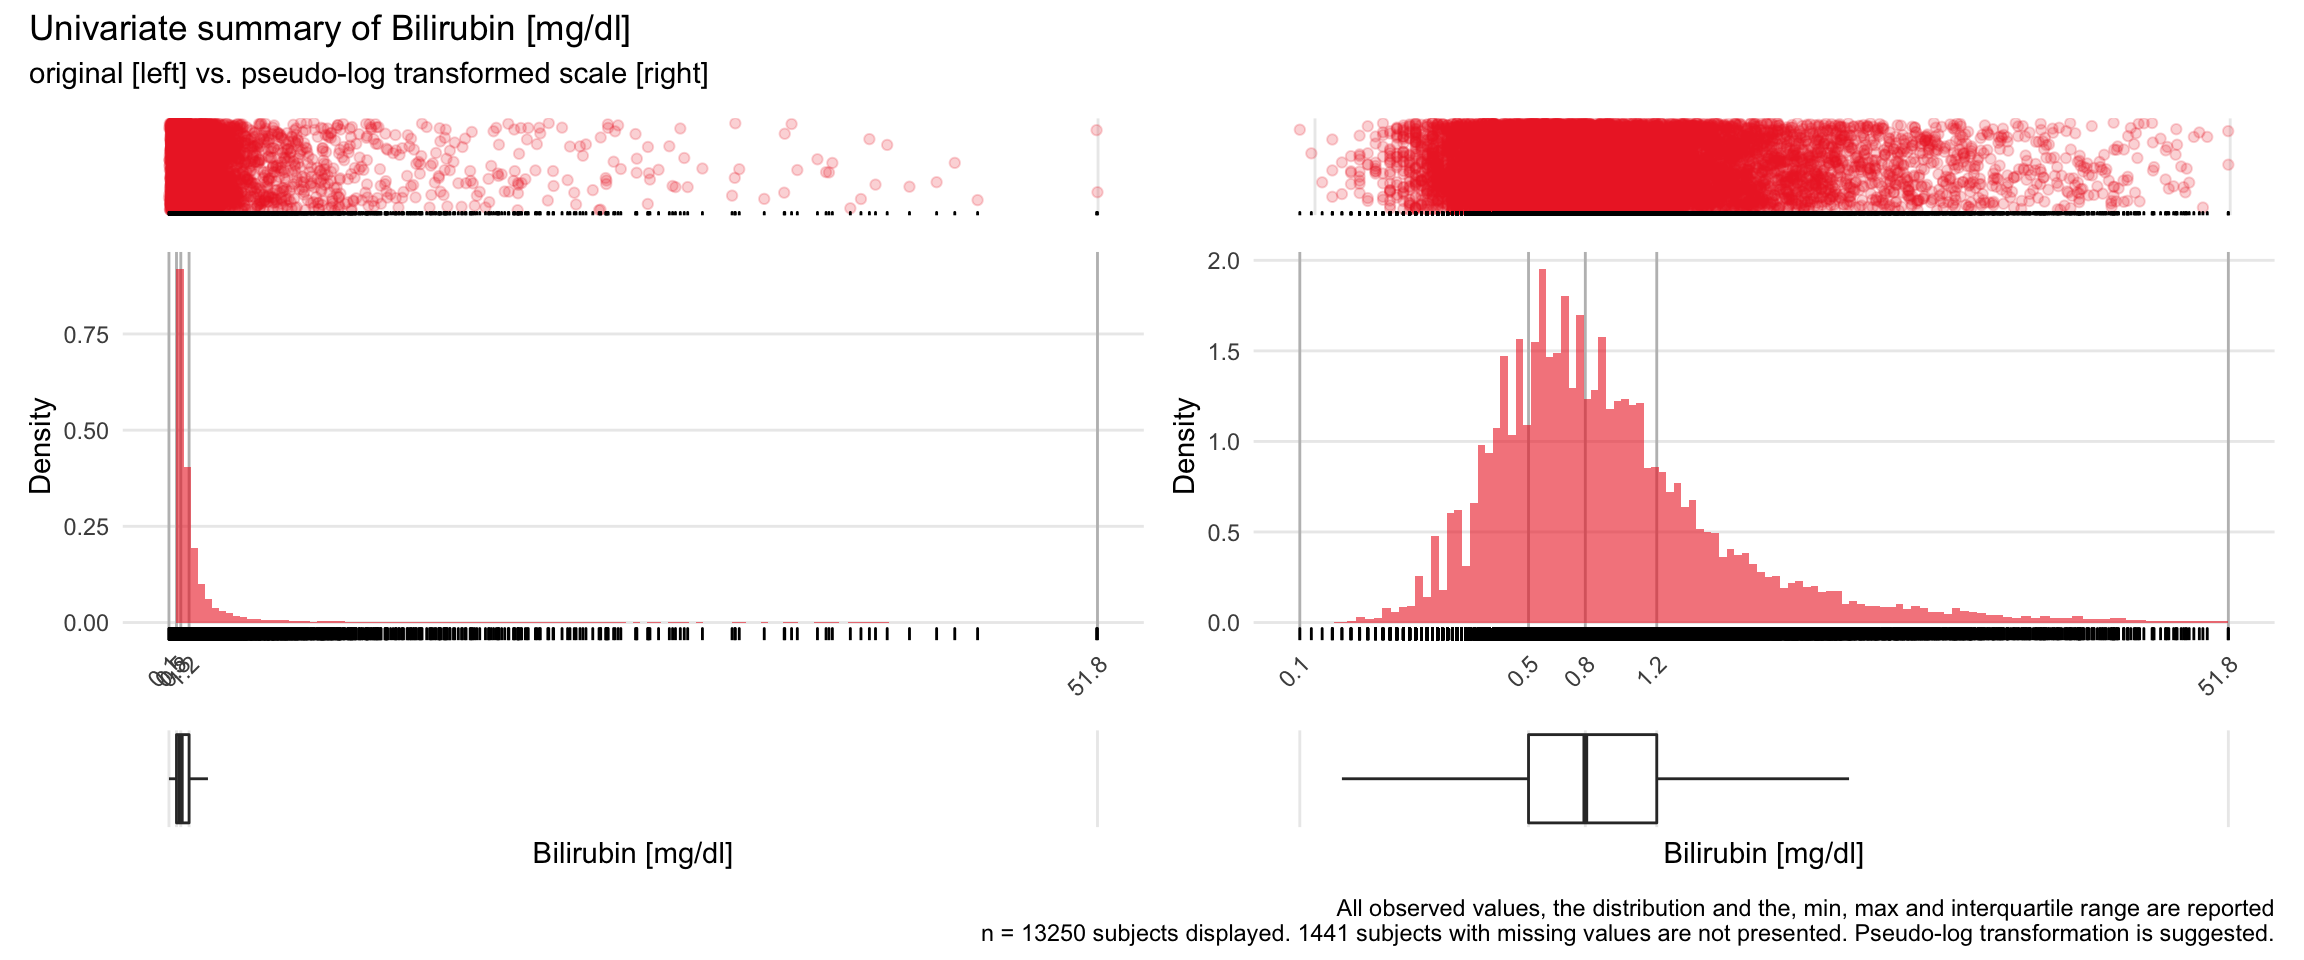

Warning: Removed 1 rows containing missing values (geom_bar).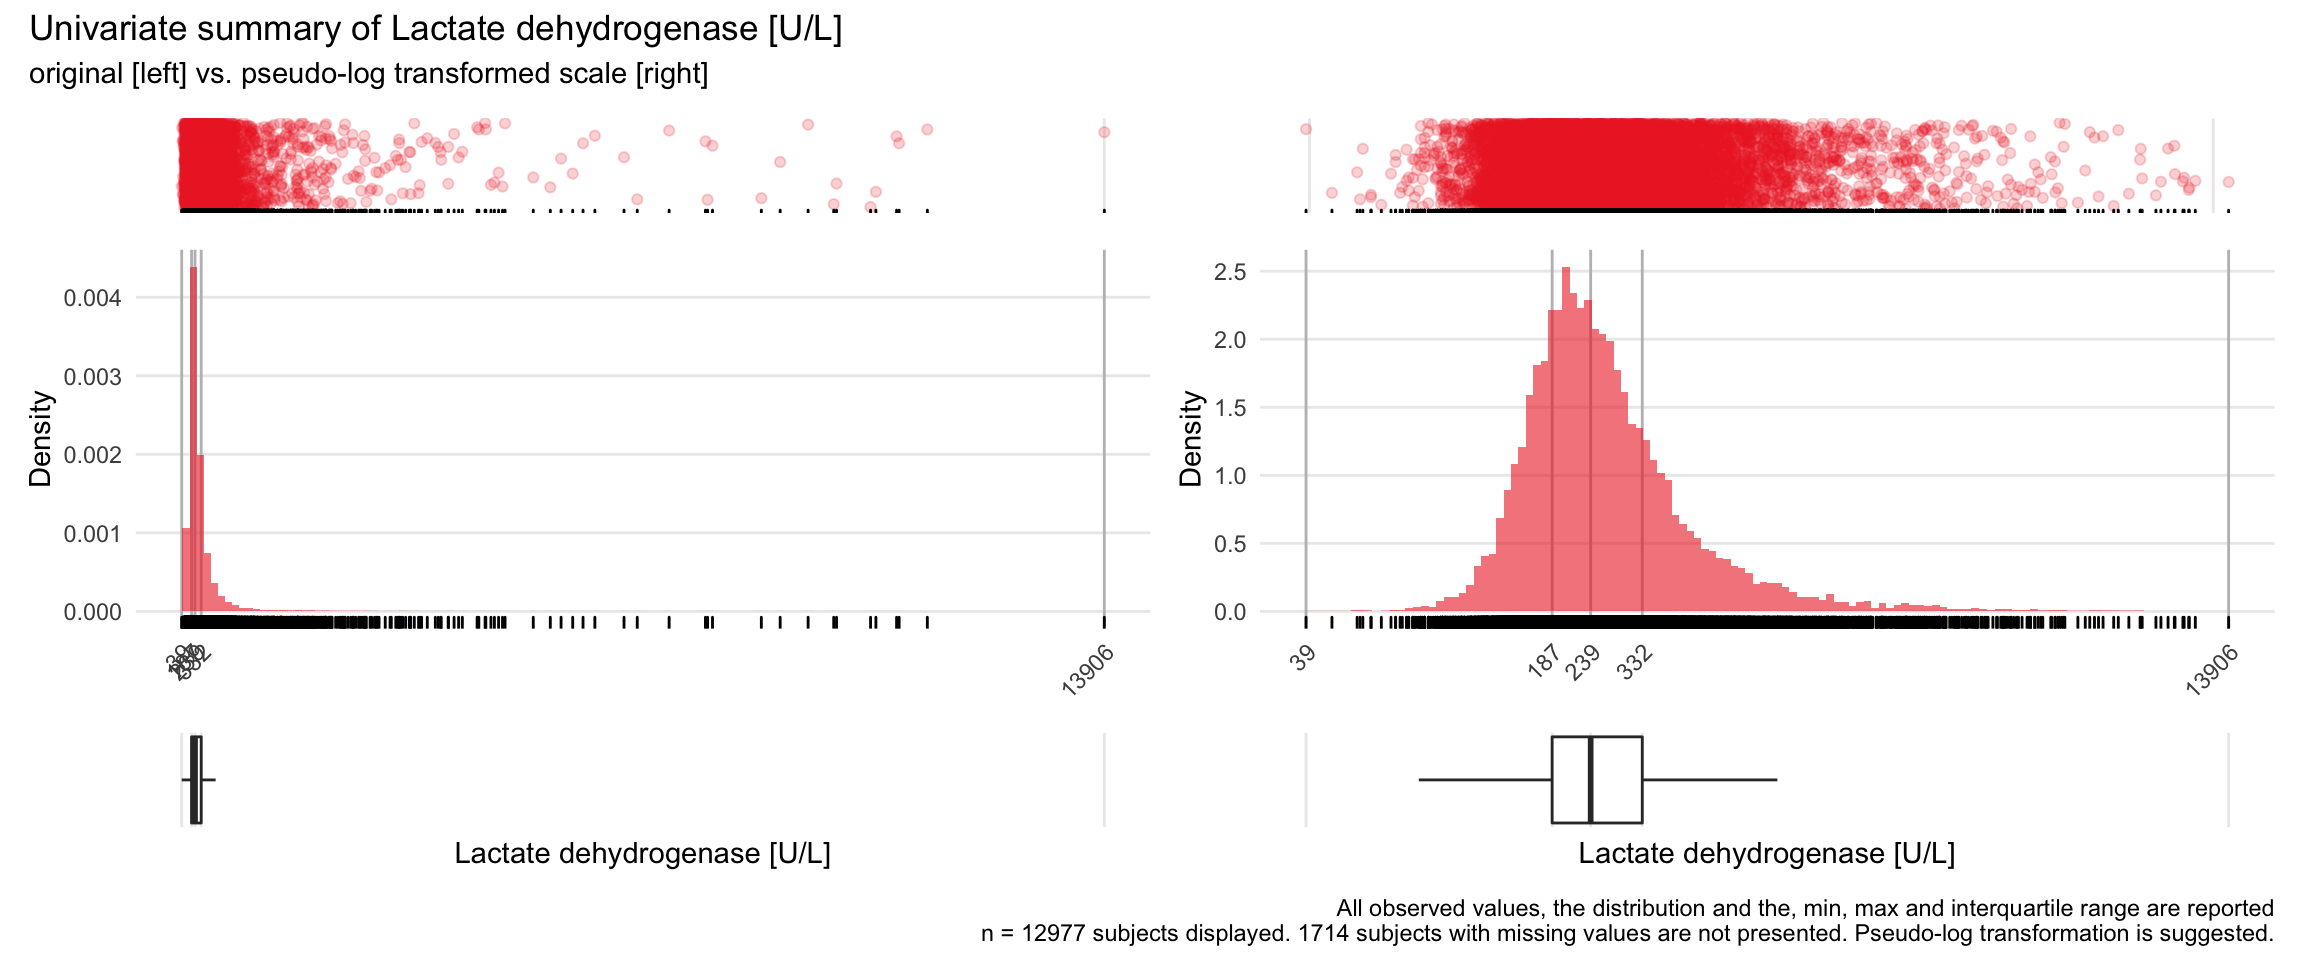
Warning: Removed 1 rows containing missing values (geom_bar).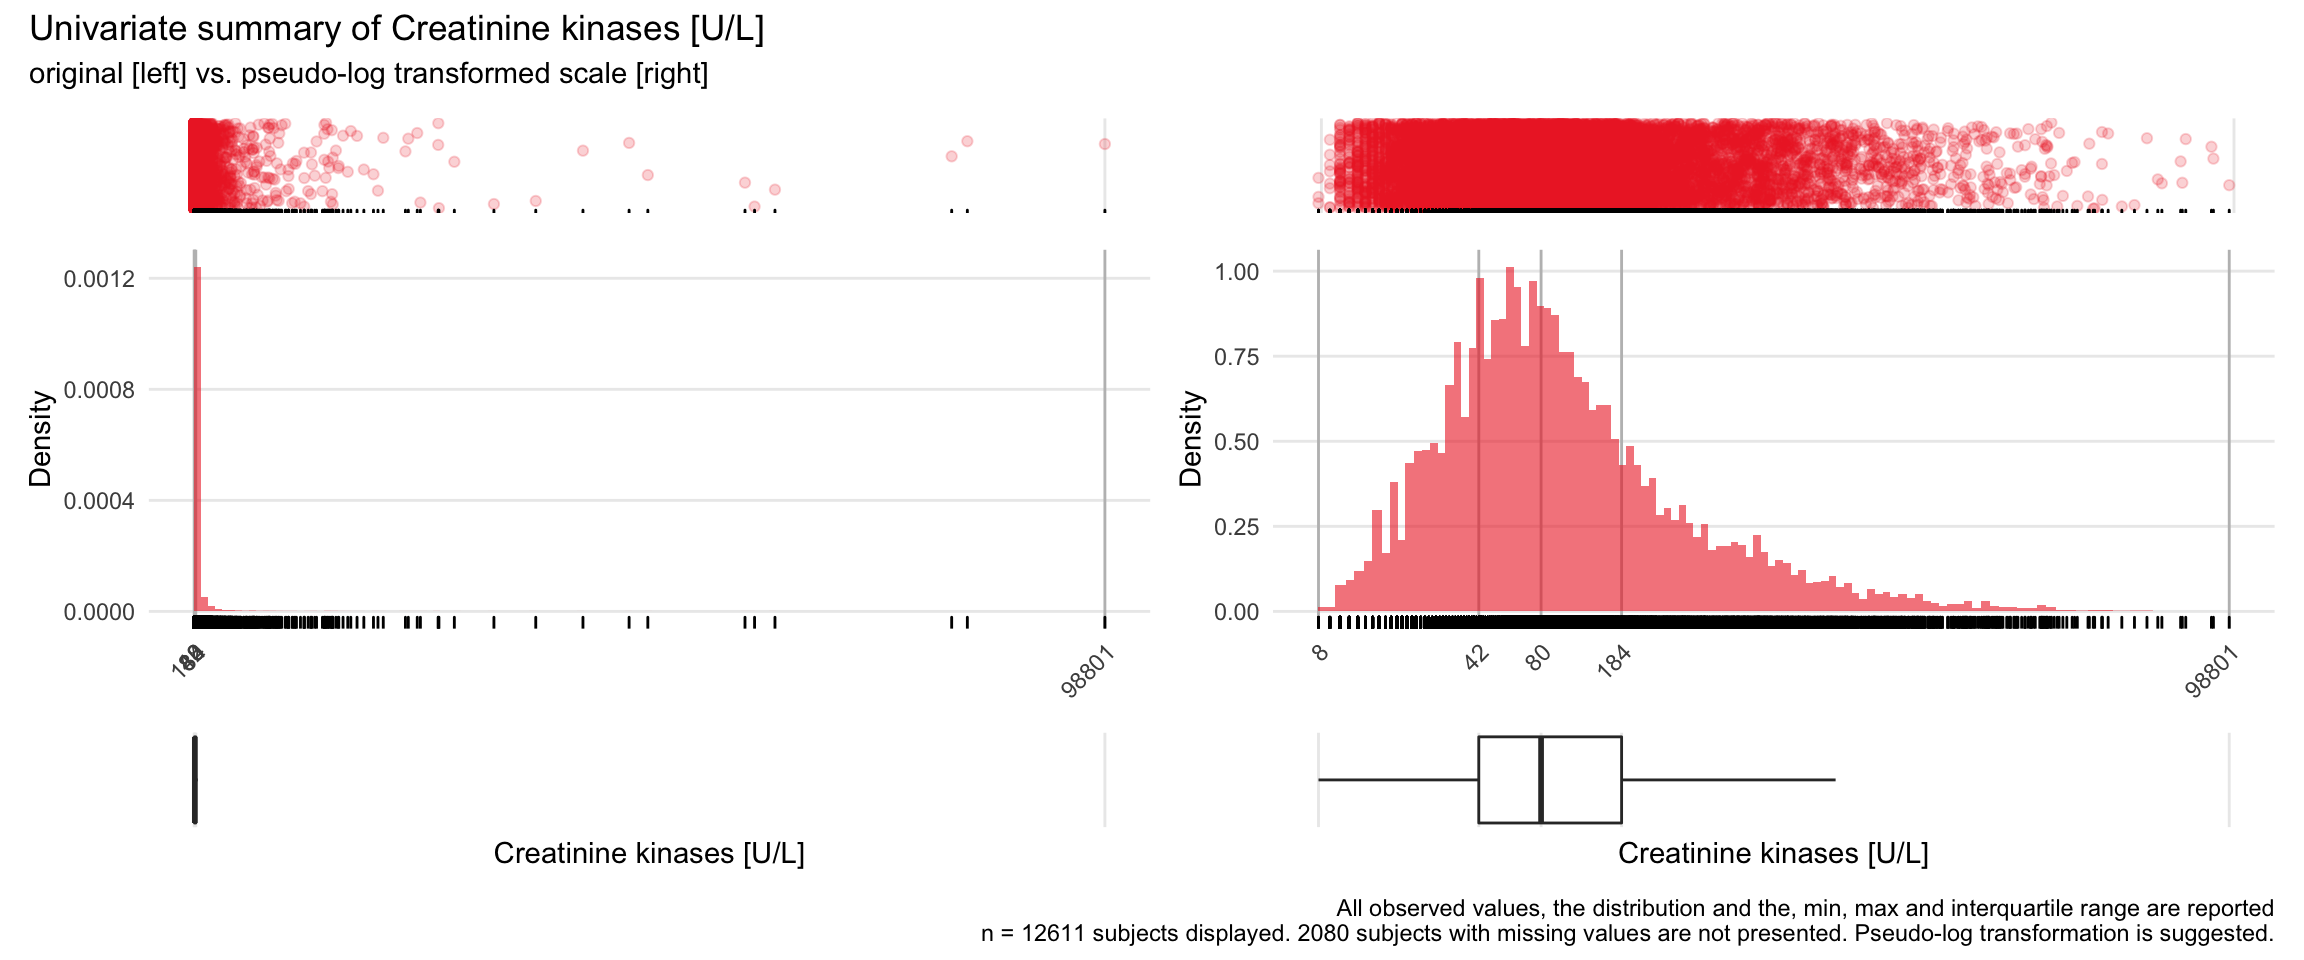

Warning: Removed 1 rows containing missing values (geom_bar).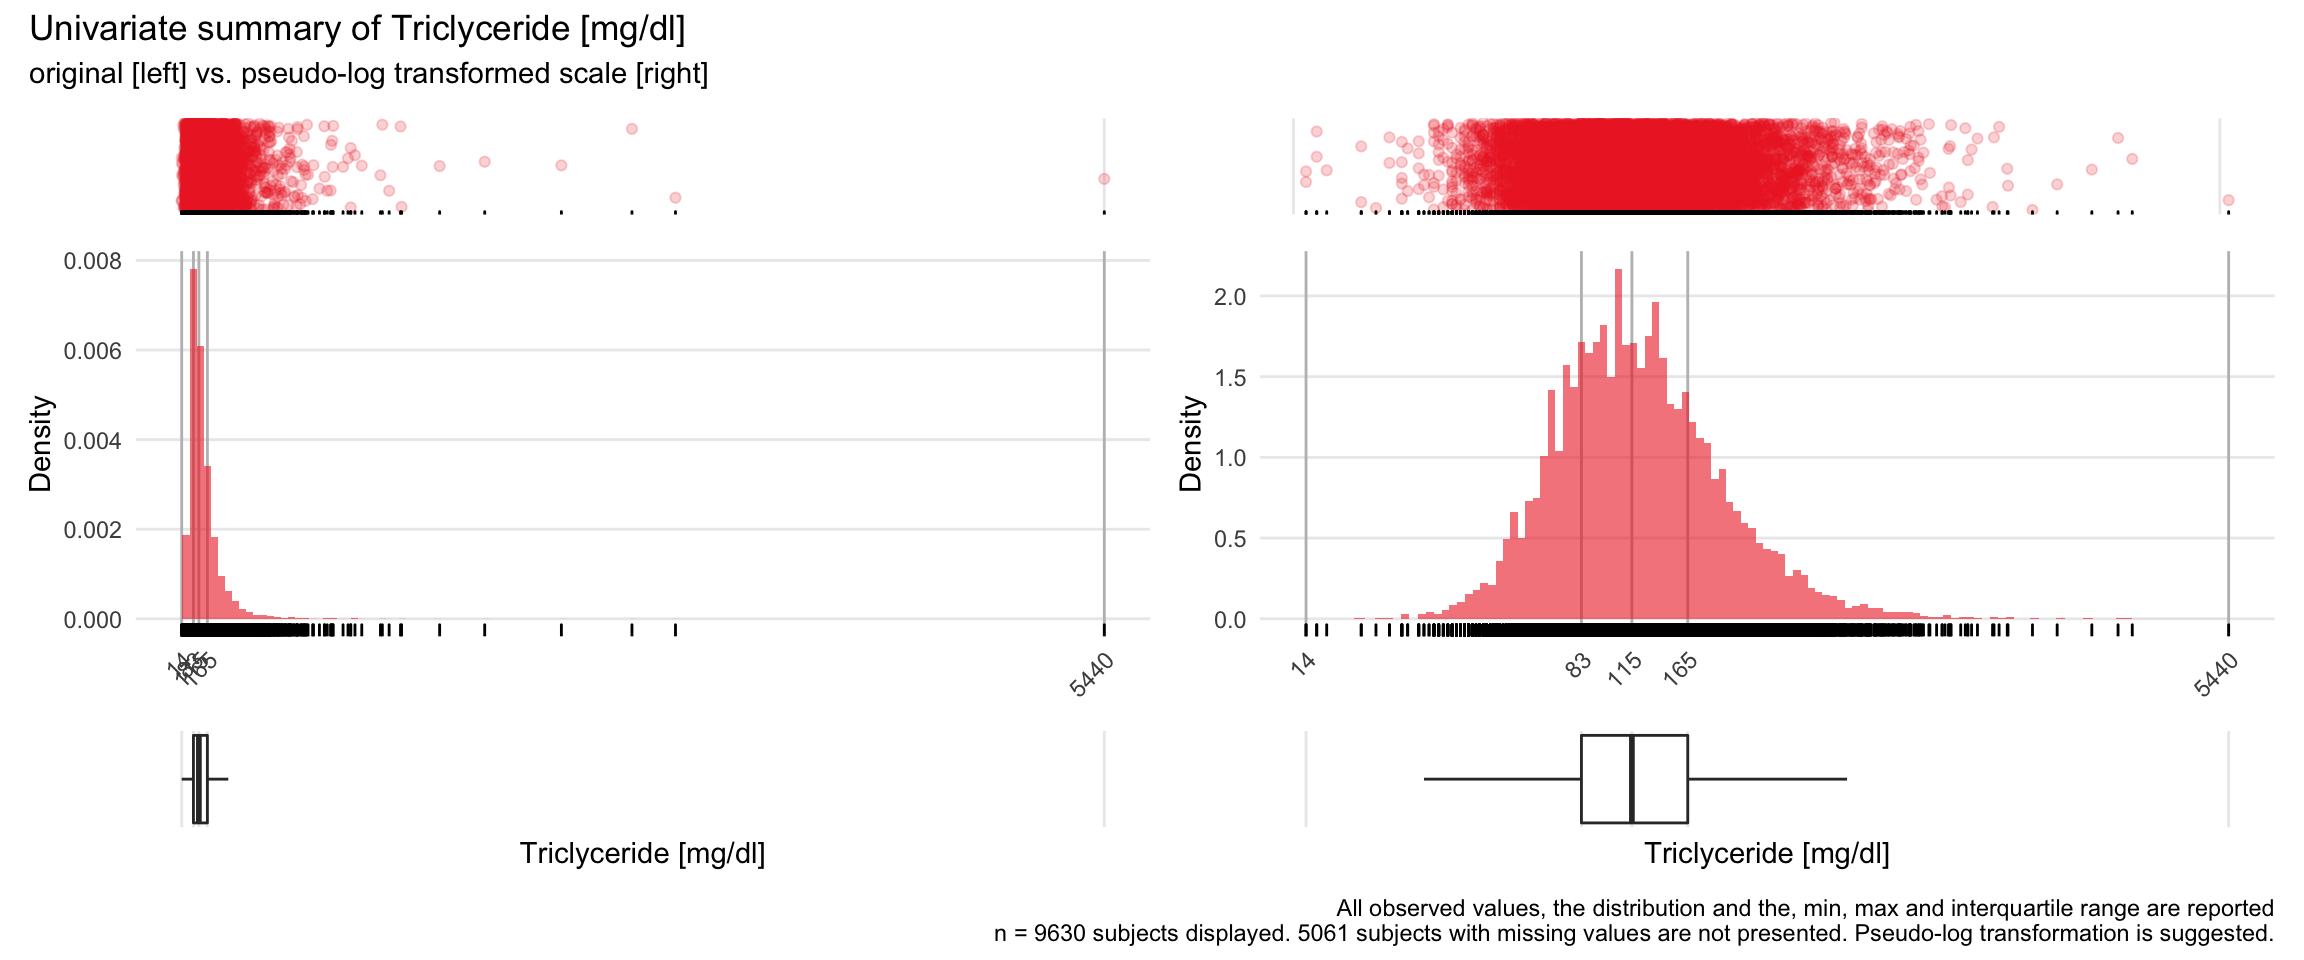
Show the code
save(list=c("c_bact", "bact_variables", "sigma_values", "bact_transformed"),
     file=here::here("data", "bact_env_c.rda"))
8.3.4 Univariate distribution with variables using only the original variable without the suggested transformations
Show the code
for(j in 1:length(unique.variables)){
  print(ida_plot_univar(b_bact, unique.variables[j], sigma=res[j], n_bars=100, transform = FALSE))
#  if(!is.na(res[j])){
#    print(ida_plot_univar(b_bact, paste("t_",variables[j],sep="")))
#  }
}

Warning: Removed 1 rows containing missing values (geom_bar).
Warning: Removed 1 rows containing missing values (geom_bar).


Warning: Removed 1 rows containing missing values (geom_bar).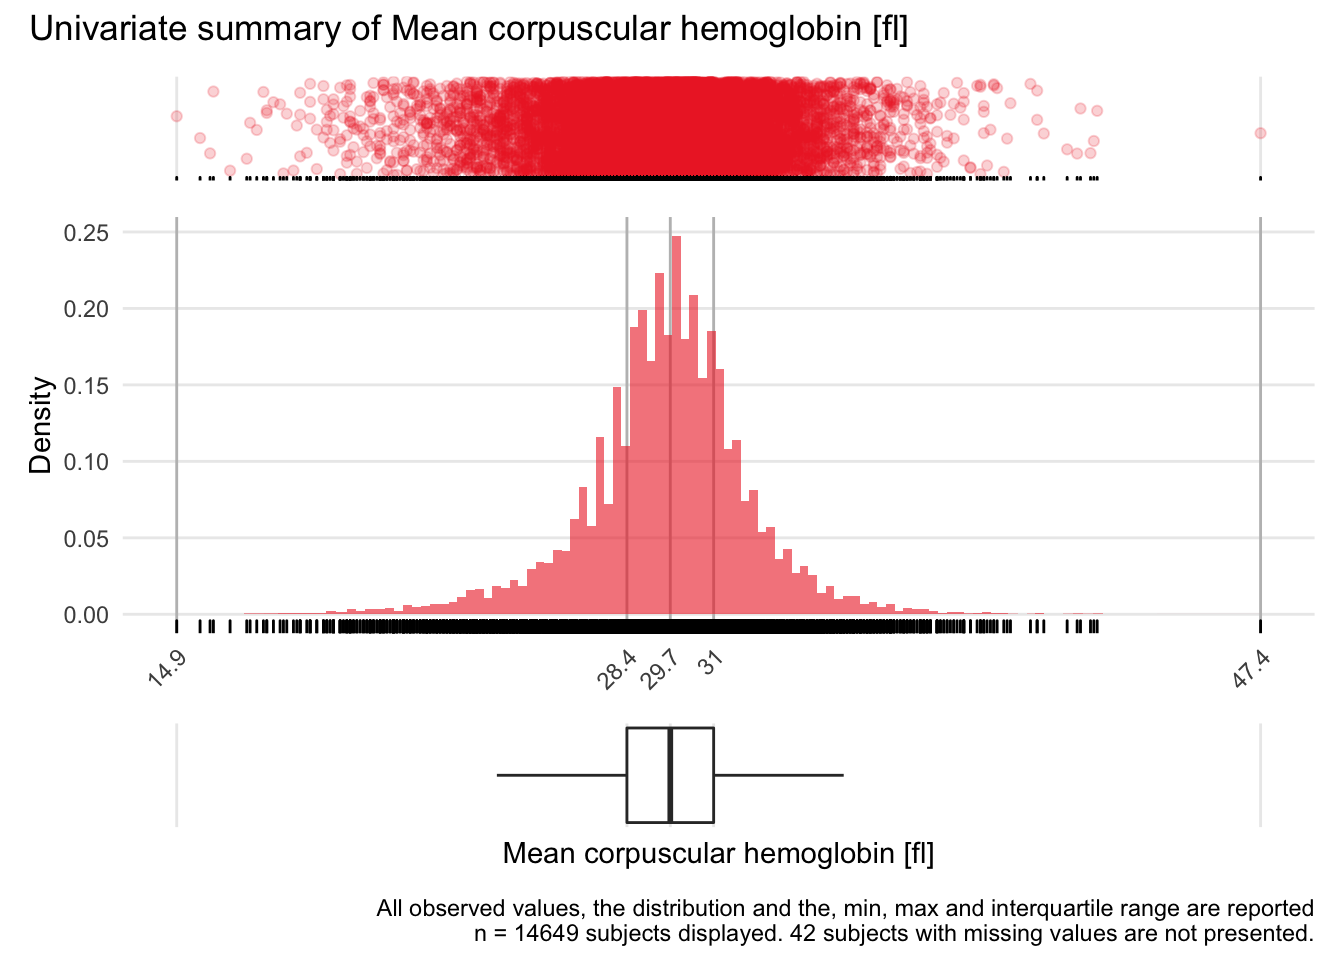
Warning: Removed 1 rows containing missing values (geom_bar).


Warning: Removed 1 rows containing missing values (geom_bar).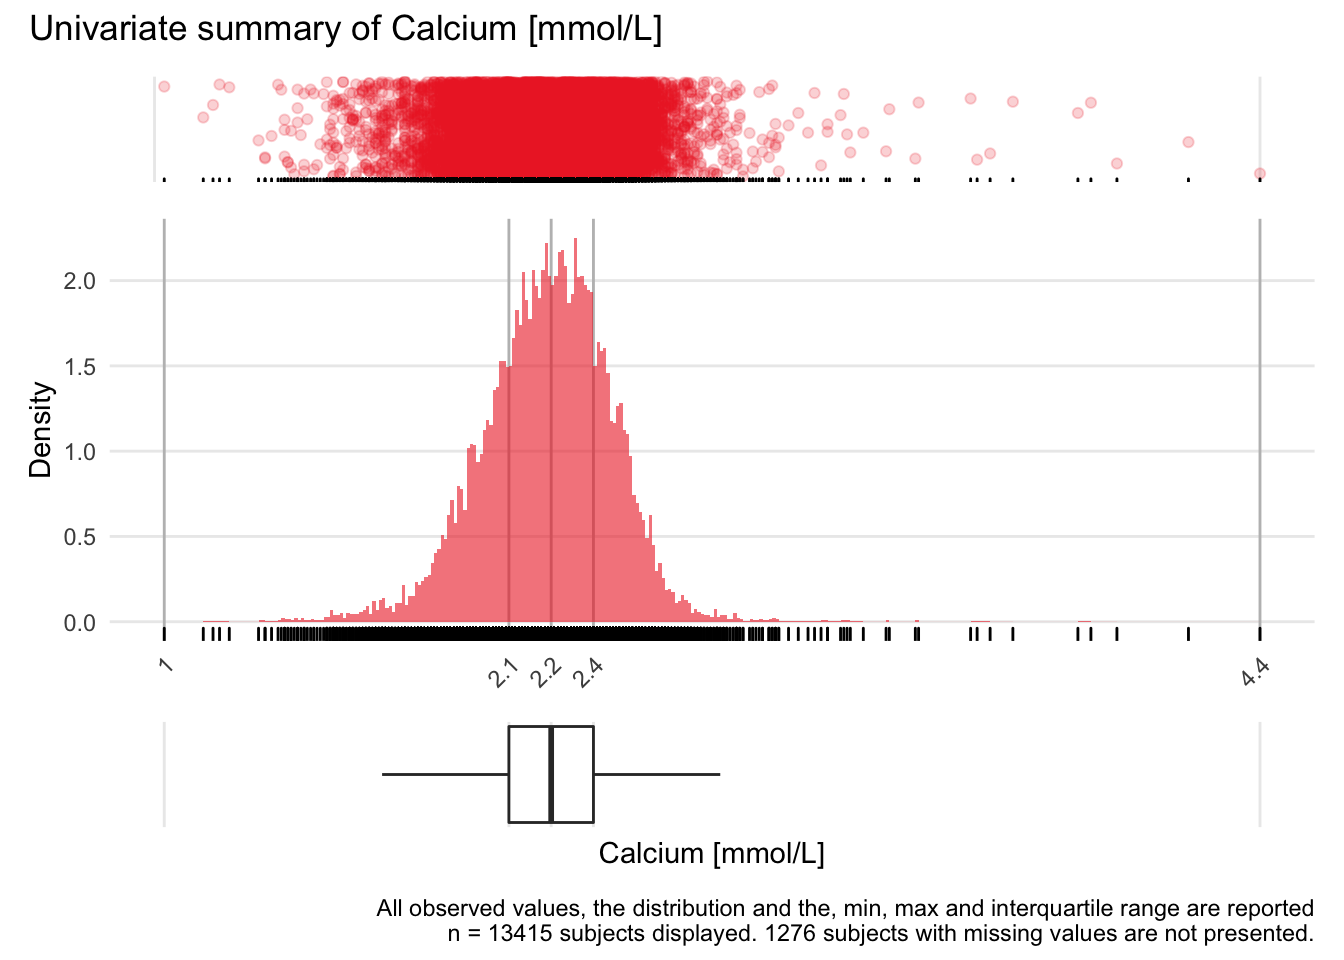


Warning: Removed 1 rows containing missing values (geom_bar).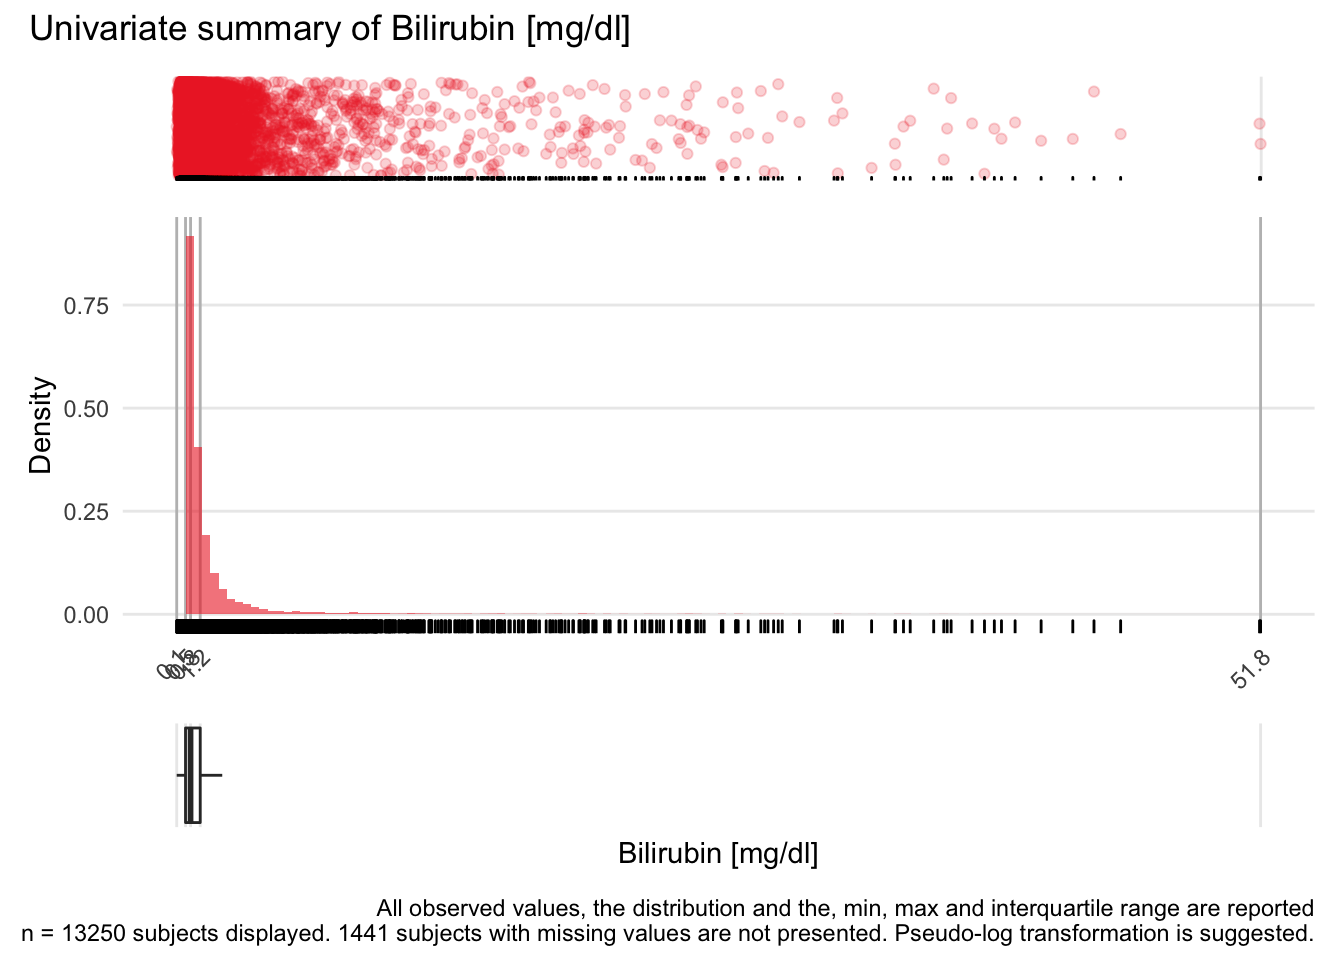


8.3.5 Comparison of univariate distributions with and without pseudo-log transformation
The comparison is only shown for variables where a transformation is suggested.
Show the code
for(j in 1:length(unique.variables)){
#  print(ida_plot_univar_orig_vs_trans(b_bact, unique.variables[j], sigma=res[j], n_bars=100))
 if(!is.na(res[j])){
   print(ida_plot_univar_orig_vs_trans(b_bact, unique.variables[j], sigma=res[j], n_bars=100))
 }
}


Warning: Removed 1 rows containing missing values (geom_bar).
Removed 1 rows containing missing values (geom_bar).


Warning: Removed 1 rows containing missing values (geom_bar).
Warning: Removed 1 rows containing missing values (geom_bar).
Warning: Removed 1 rows containing missing values (geom_bar).
8.4 Section session info
R version 4.1.2 (2021-11-01)
Platform: x86_64-apple-darwin17.0 (64-bit)
Running under: macOS Big Sur 10.16

Matrix products: default
BLAS:   /Library/Frameworks/R.framework/Versions/4.1/Resources/lib/libRblas.0.dylib
LAPACK: /Library/Frameworks/R.framework/Versions/4.1/Resources/lib/libRlapack.dylib

locale:
[1] en_US.UTF-8/en_US.UTF-8/en_US.UTF-8/C/en_US.UTF-8/en_US.UTF-8

attached base packages:
[1] stats     graphics  grDevices datasets  utils     methods   base

other attached packages:
 [1] Hmisc_4.6-0     Formula_1.2-4   survival_3.2-13 lattice_0.20-45
 [5] forcats_0.5.1   stringr_1.4.0   dplyr_1.0.9     purrr_0.3.4
 [9] readr_2.1.1     tidyr_1.2.0     tibble_3.1.7    ggplot2_3.3.6
[13] tidyverse_1.3.1 here_1.0.1

loaded via a namespace (and not attached):
 [1] httr_1.4.2          jsonlite_1.7.2      splines_4.1.2
 [4] modelr_0.1.8        assertthat_0.2.1    latticeExtra_0.6-29
 [7] renv_0.15.5         cellranger_1.1.0    pillar_1.7.0
[10] backports_1.4.1     glue_1.6.2          digest_0.6.29
[13] checkmate_2.1.0     RColorBrewer_1.1-3  rvest_1.0.2
[16] colorspace_2.0-3    htmltools_0.5.2     Matrix_1.3-4
[19] pkgconfig_2.0.3     broom_0.8.0         haven_2.4.3
[22] patchwork_1.1.1     scales_1.2.0        jpeg_0.1-9
[25] tzdb_0.2.0          htmlTable_2.3.0     farver_2.1.0
[28] generics_0.1.2      ellipsis_0.3.2      withr_2.5.0
[31] nnet_7.3-16         cli_3.3.0           magrittr_2.0.3
[34] crayon_1.5.1        readxl_1.3.1        evaluate_0.14
[37] fs_1.5.2            fansi_1.0.3         xml2_1.3.3
[40] foreign_0.8-81      data.table_1.14.2   tools_4.1.2
[43] hms_1.1.1           lifecycle_1.0.1     munsell_0.5.0
[46] reprex_2.0.1        cluster_2.1.2       compiler_4.1.2
[49] rlang_1.0.3         grid_4.1.2          rstudioapi_0.13
[52] htmlwidgets_1.5.4   labeling_0.4.2      base64enc_0.1-3
[55] rmarkdown_2.11      gtable_0.3.0        DBI_1.1.2
[58] R6_2.5.1            gridExtra_2.3       lubridate_1.8.0
[61] knitr_1.37          fastmap_1.1.0       utf8_1.2.2
[64] rprojroot_2.0.2     stringi_1.7.6       Rcpp_1.0.8.3
[67] vctrs_0.4.1         rpart_4.1-15        png_0.1-7
[70] dbplyr_2.1.1        tidyselect_1.1.2    xfun_0.31