Chapter 12 Univariate distribution checks
This section reports a series of univariate summary checks of the NHANES dataset.
12.1 Data set overview
Using the Hmisc describe function, we provide an overview of the data set. The descriptive report also provides histograms of continuous variables. For ease of scanning the information, we group the report by measurement type.
12.1.1 Demographic and lifestyle variables
6 Variables 5972 Observations
age years

| n | missing | distinct | Info | Mean | Gmd | .05 | .10 | .25 | .50 | .75 | .90 | .95 |
|---|---|---|---|---|---|---|---|---|---|---|---|---|
| 5972 | 0 | 660 | 1 | 54.87 | 17.64 | 32.17 | 34.58 | 41.65 | 53.75 | 67.25 | 76.50 | 80.83 |
gender
| n | missing | distinct |
|---|---|---|
| 5972 | 0 | 2 |
 Value        Male Female
 Frequency    2935   3037
 Proportion  0.491  0.509
educationadult: education level

| n | missing | distinct |
|---|---|---|
| 5968 | 4 | 3 |
 Value      Less than high school           High school More than high school
 Frequency                   1683                  1448                  2837
 Proportion                 0.282                 0.243                 0.475
bmi: body mass index kg/m2

| n | missing | distinct | Info | Mean | Gmd | .05 | .10 | .25 | .50 | .75 | .90 | .95 |
|---|---|---|---|---|---|---|---|---|---|---|---|---|
| 5928 | 44 | 2161 | 1 | 29.07 | 6.804 | 20.78 | 22.12 | 24.73 | 28.08 | 32.23 | 37.07 | 40.80 |
smokecigs: smoking status

| n | missing | distinct |
|---|---|---|
| 5970 | 2 | 3 |
 Value        Never  Former Current
 Frequency     2911    1759    1300
 Proportion   0.488   0.295   0.218
alcohol: alcohol consumption

| n | missing | distinct | Info | Mean | Gmd |
|---|---|---|---|---|---|
| 5577 | 395 | 3 | 0.776 | 1.516 | 0.624 |
 Value          1     2     3
 Frequency   3090  2098   389
 Proportion 0.554 0.376 0.070
12.1.2 Physiological measurements
3 Variables 5972 Observations
sys: Systolic blood pressure mg/dl

| n | missing | distinct | Info | Mean | Gmd | .05 | .10 | .25 | .50 | .75 | .90 | .95 |
|---|---|---|---|---|---|---|---|---|---|---|---|---|
| 5698 | 274 | 137 | 1 | 127.4 | 22.26 | 100.0 | 105.0 | 113.0 | 124.0 | 138.0 | 154.0 | 166.1 |
lbxtc: Total cholesterol mg/dl

| n | missing | distinct | Info | Mean | Gmd | .05 | .10 | .25 | .50 | .75 | .90 | .95 |
|---|---|---|---|---|---|---|---|---|---|---|---|---|
| 5742 | 230 | 264 | 1 | 204.1 | 46.4 | 143 | 155 | 175 | 201 | 228 | 258 | 277 |
lbdhdd: HDL cholesterol mg/dl

| n | missing | distinct | Info | Mean | Gmd | .05 | .10 | .25 | .50 | .75 | .90 | .95 |
|---|---|---|---|---|---|---|---|---|---|---|---|---|
| 5742 | 230 | 109 | 1 | 54.64 | 17.91 | 33 | 37 | 43 | 52 | 64 | 76 | 85 |
12.1.3 Comorbidities
4 Variables 5972 Observations
diabetes
| n | missing | distinct |
|---|---|---|
| 5972 | 0 | 2 |
 Value         No   Yes
 Frequency   5214   758
 Proportion 0.873 0.127
chf: congestive heart failure
| n | missing | distinct |
|---|---|---|
| 5972 | 0 | 2 |
 Value         No   Yes
 Frequency   5739   233
 Proportion 0.961 0.039
cancer
| n | missing | distinct |
|---|---|---|
| 5972 | 0 | 2 |
 Value         No   Yes
 Frequency   5359   613
 Proportion 0.897 0.103
stroke
| n | missing | distinct |
|---|---|---|
| 5972 | 0 | 2 |
 Value        No  Yes
 Frequency  5734  238
 Proportion 0.96 0.04
12.1.4 Physical activity variables
16 Variables 5972 Observations
tac: total activity counts per day

| n | missing | distinct | Info | Mean | Gmd | .05 | .10 | .25 | .50 | .75 | .90 | .95 |
|---|---|---|---|---|---|---|---|---|---|---|---|---|
| 5972 | 0 | 5965 | 1 | 244811 | 143738 | 69233 | 94872 | 150571 | 223572 | 314224 | 417410 | 486450 |
| lowest : | 8263.000 | 8931.833 | 12123.000 | 14642.000 | 15656.000 |
| highest: | 981517.167 | 986261.000 | 986593.800 | 1097823.500 | 1122542.600 |
tlac: total log activity count (log(1+activity))

| n | missing | distinct | Info | Mean | Gmd | .05 | .10 | .25 | .50 | .75 | .90 | .95 |
|---|---|---|---|---|---|---|---|---|---|---|---|---|
| 5972 | 0 | 5969 | 1 | 2900 | 873.5 | 1613 | 1900 | 2385 | 2911 | 3431 | 3877 | 4164 |
| lowest : | 313.0835 | 364.4561 | 400.8157 | 429.9288 | 466.0362 |
| highest: | 5436.1548 | 5492.5395 | 5588.3401 | 5655.4680 | 6122.6779 |
mvpa: Moderate or vigorous physical activity minutes

| n | missing | distinct | Info | Mean | Gmd | .05 | .10 | .25 | .50 | .75 | .90 | .95 |
|---|---|---|---|---|---|---|---|---|---|---|---|---|
| 5972 | 0 | 1163 | 1 | 19.19 | 20.9 | 0.800 | 1.429 | 4.000 | 12.000 | 26.762 | 46.000 | 59.921 |
| lowest : | 0.0000000 | 0.1428571 | 0.1666667 | 0.2000000 | 0.2500000 |
| highest: | 180.8333333 | 186.2000000 | 194.8000000 | 208.5000000 | 249.0000000 |
wt: total accelerometer wear time minutes

| n | missing | distinct | Info | Mean | Gmd | .05 | .10 | .25 | .50 | .75 | .90 | .95 |
|---|---|---|---|---|---|---|---|---|---|---|---|---|
| 5972 | 0 | 3613 | 1 | 866.1 | 139.8 | 684.3 | 721.0 | 782.9 | 852.1 | 922.0 | 1000.6 | 1111.5 |
tlac.1: total log actvity count 12:00AM-2:00AM

| n | missing | distinct | Info | Mean | Gmd | .05 | .10 | .25 | .50 | .75 | .90 | .95 |
|---|---|---|---|---|---|---|---|---|---|---|---|---|
| 5972 | 0 | 2656 | 0.829 | 30.92 | 51.83 | 0.00 | 0.00 | 0.00 | 0.00 | 24.38 | 94.43 | 169.25 |
| lowest : | 0.0000000 | 0.1569446 | 0.1831020 | 0.2299197 | 0.2559656 |
| highest: | 597.3808309 | 620.0469233 | 674.1677375 | 709.3300116 | 719.0239316 |
tlac.2: total log actvity count 2:00AM-4:00AM

| n | missing | distinct | Info | Mean | Gmd | .05 | .10 | .25 | .50 | .75 | .90 | .95 |
|---|---|---|---|---|---|---|---|---|---|---|---|---|
| 5972 | 0 | 1770 | 0.653 | 19.09 | 34.47 | 0.00 | 0.00 | 0.00 | 0.00 | 2.91 | 51.83 | 110.64 |
| lowest : | 0.00000000 | 0.09902103 | 0.11552453 | 0.15694461 | 0.23104906 |
| highest: | 586.34967162 | 611.00545824 | 617.44773130 | 737.25383394 | 775.42871350 |
tlac.3: total log actvity count 4:00AM-6:00AM

| n | missing | distinct | Info | Mean | Gmd | .05 | .10 | .25 | .50 | .75 | .90 | .95 |
|---|---|---|---|---|---|---|---|---|---|---|---|---|
| 5972 | 0 | 2834 | 0.855 | 43.29 | 70.78 | 0.00 | 0.00 | 0.00 | 0.00 | 38.74 | 147.59 | 248.43 |
| lowest : | 0.0000000 | 0.1155245 | 0.1386294 | 0.2299197 | 0.2682397 |
| highest: | 679.1484297 | 697.1093552 | 704.5766819 | 719.3198459 | 769.6014301 |
tlac.4: total log actvity count 6:00AM-8:00AM

| n | missing | distinct | Info | Mean | Gmd | .05 | .10 | .25 | .50 | .75 | .90 | .95 |
|---|---|---|---|---|---|---|---|---|---|---|---|---|
| 5972 | 0 | 5285 | 0.998 | 177 | 178.6 | 0.00 | 0.00 | 36.94 | 137.34 | 282.09 | 416.35 | 496.25 |
| lowest : | 0.0000000 | 0.2299197 | 0.3465736 | 0.6148132 | 0.6839274 |
| highest: | 774.8811640 | 792.6938042 | 822.1482092 | 832.9933042 | 857.9018816 |
tlac.5: total log actvity count 8:00AM-10:00AM

| n | missing | distinct | Info | Mean | Gmd | .05 | .10 | .25 | .50 | .75 | .90 | .95 |
|---|---|---|---|---|---|---|---|---|---|---|---|---|
| 5972 | 0 | 5834 | 1 | 339.3 | 191.7 | 39.52 | 102.56 | 221.28 | 346.74 | 460.18 | 552.17 | 610.19 |
| lowest : | 0.0000000 | 0.2310491 | 0.7250248 | 0.8652549 | 1.0357837 |
| highest: | 812.0225306 | 812.8675420 | 813.2942210 | 824.5800445 | 888.1759271 |
tlac.6: total log actvity count 10:00AM-12:00PM

| n | missing | distinct | Info | Mean | Gmd | .05 | .10 | .25 | .50 | .75 | .90 | .95 |
|---|---|---|---|---|---|---|---|---|---|---|---|---|
| 5972 | 0 | 5931 | 1 | 407.7 | 163.6 | 150.4 | 218.6 | 316.2 | 415.0 | 506.7 | 589.9 | 634.9 |
| lowest : | 0.0000000 | 0.6986213 | 2.6001909 | 4.5903937 | 5.7234361 |
| highest: | 807.7712473 | 808.7247458 | 811.5701740 | 884.1169241 | 892.0314653 |
tlac.7: total log actvity count 12:00PM-2:00PM

| n | missing | distinct | Info | Mean | Gmd | .05 | .10 | .25 | .50 | .75 | .90 | .95 |
|---|---|---|---|---|---|---|---|---|---|---|---|---|
| 5972 | 0 | 5947 | 1 | 418 | 146.9 | 192.1 | 250.4 | 337.6 | 423.5 | 507.2 | 581.3 | 623.7 |
| lowest : | 0.000000 | 1.734669 | 2.704424 | 5.605670 | 6.387910 |
| highest: | 788.370472 | 796.082067 | 813.380498 | 821.733575 | 885.445891 |
tlac.8: total log actvity count 2:00PM-4:00PM

| n | missing | distinct | Info | Mean | Gmd | .05 | .10 | .25 | .50 | .75 | .90 | .95 |
|---|---|---|---|---|---|---|---|---|---|---|---|---|
| 5972 | 0 | 5954 | 1 | 411.7 | 147.8 | 192.1 | 243.1 | 323.6 | 414.3 | 501.7 | 577.5 | 619.9 |
| lowest : | 0.000000 | 1.974752 | 3.096473 | 4.094345 | 5.772020 |
| highest: | 792.683985 | 837.042353 | 846.553847 | 877.212734 | 904.872351 |
tlac.9: total log actvity count 4:00PM-6:00PM

| n | missing | distinct | Info | Mean | Gmd | .05 | .10 | .25 | .50 | .75 | .90 | .95 |
|---|---|---|---|---|---|---|---|---|---|---|---|---|
| 5972 | 0 | 5955 | 1 | 397 | 140.3 | 185.4 | 234.8 | 316.4 | 401.8 | 483.5 | 553.6 | 591.4 |
| lowest : | 0.000000 | 2.957040 | 3.401197 | 4.148165 | 5.084134 |
| highest: | 771.497952 | 783.128869 | 801.039991 | 809.429425 | 822.294800 |
tlac.10: total log actvity count 6:00PM-8:00PM

| n | missing | distinct | Info | Mean | Gmd | .05 | .10 | .25 | .50 | .75 | .90 | .95 |
|---|---|---|---|---|---|---|---|---|---|---|---|---|
| 5972 | 0 | 5932 | 1 | 337.6 | 151.3 | 114.1 | 165.5 | 246.6 | 339.5 | 433.1 | 504.4 | 548.9 |
| lowest : | 0.000000 | 1.311822 | 1.353699 | 1.753975 | 3.459493 |
| highest: | 778.168243 | 778.774433 | 802.020060 | 851.421446 | 860.123328 |
tlac.11: total log actvity count 8:00PM-10:00PM

| n | missing | distinct | Info | Mean | Gmd | .05 | .10 | .25 | .50 | .75 | .90 | .95 |
|---|---|---|---|---|---|---|---|---|---|---|---|---|
| 5972 | 0 | 5786 | 1 | 223.2 | 158.2 | 10.22 | 42.32 | 116.77 | 212.72 | 315.90 | 411.75 | 471.84 |
| lowest : | 0.0000000 | 0.6229449 | 0.6708919 | 1.0233141 | 1.0525597 |
| highest: | 724.9040071 | 753.8848070 | 821.4989318 | 826.3463412 | 839.8942777 |
tlac.12: total log actvity count 10:00PM-12:00AM

        n  missing distinct     Info     Mean      Gmd      .05      .10      .25
     5972        0     4943    0.995    95.37    114.3    0.000    0.000    6.693
      .50      .75      .90      .95
   55.438  141.863  251.308  328.945
| lowest : | 0.00000000 | 0.09902103 | 0.17328680 | 0.27798716 | 0.41291025 |
| highest: | 683.58618305 | 698.46723961 | 702.66304648 | 707.15487443 | 733.61717206 |
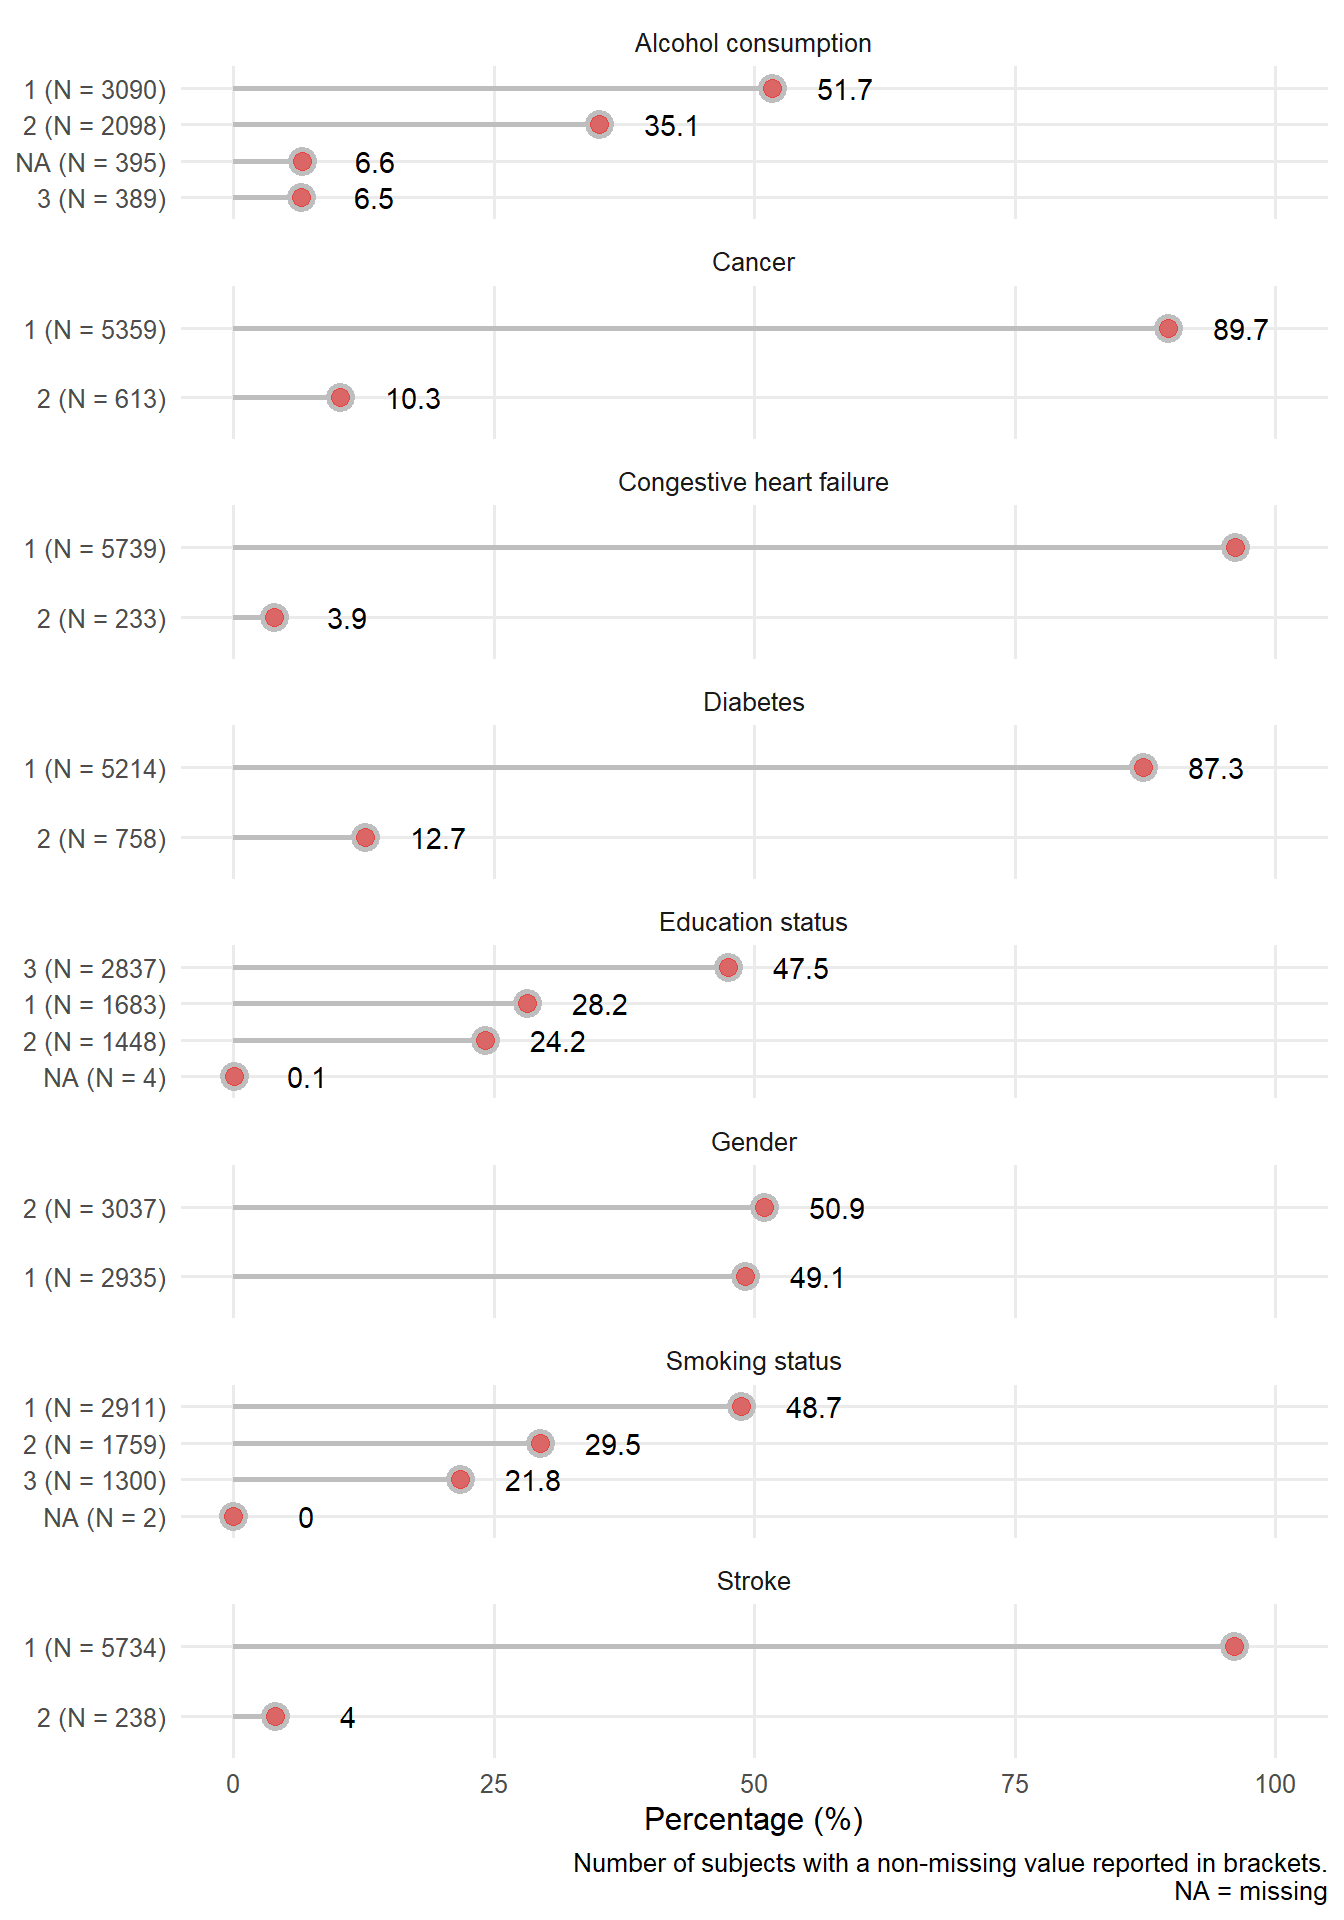
12.2 Categorical variables
We now provide a closer visual examination of the categorical predictors.
12.3 Continuous variables
A closer visual examination of continuous predictors and the outcome variable.
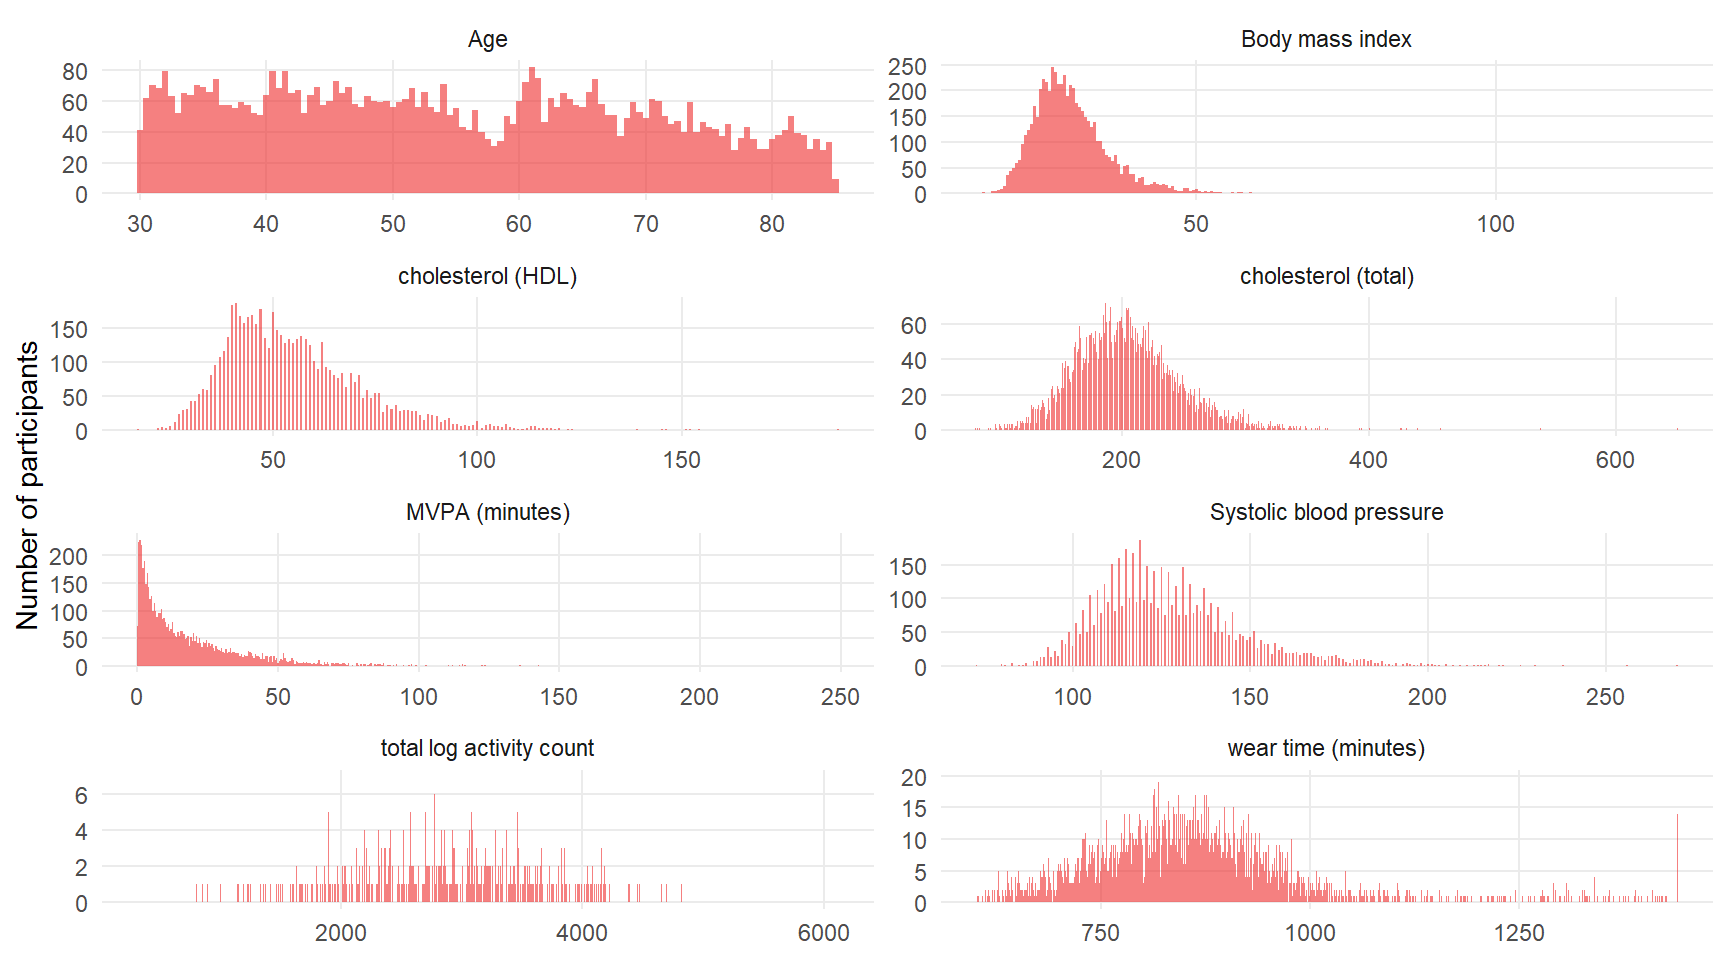
There is evidence of influential points in some of the distributions. This is explored further with targeted summaries. A more detailed univariate summaries for the variables of interest are also provided below.
12.3.3 Body mass index
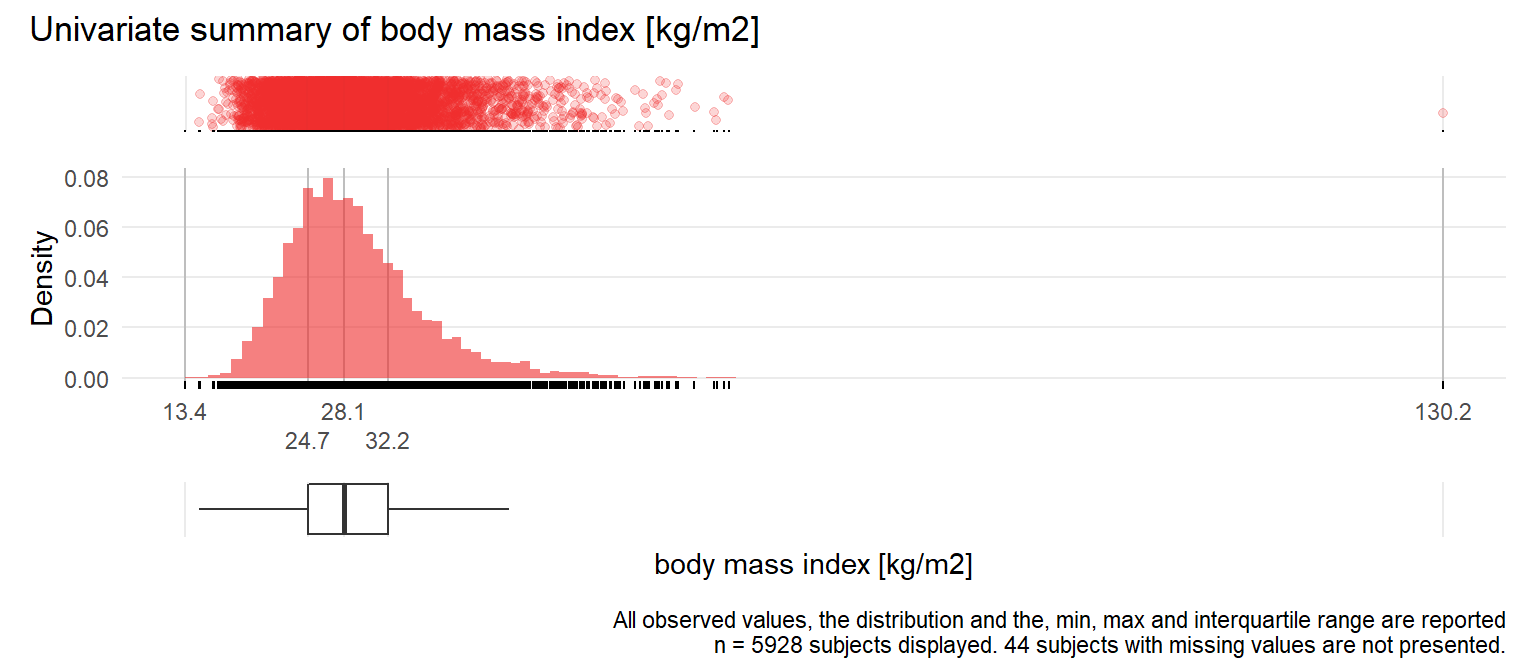
Figure 7.2: Distribution of respiratory rate
There is a participant with an unusual high value (130.2). It is possible that this is an entry error (bmi=30.2).
12.3.4 Outcome= Time of moderate or vigrous physical activity and related variables
![Distribution of time of moderate/vigorous activity [minutes]](nhanes_univar_files/figure-html/unnamed-chunk-6-1.png)
Figure 7.3: Distribution of time of moderate/vigorous activity [minutes]
After transforming MVPA with \(\log_{10}(x+1)\):
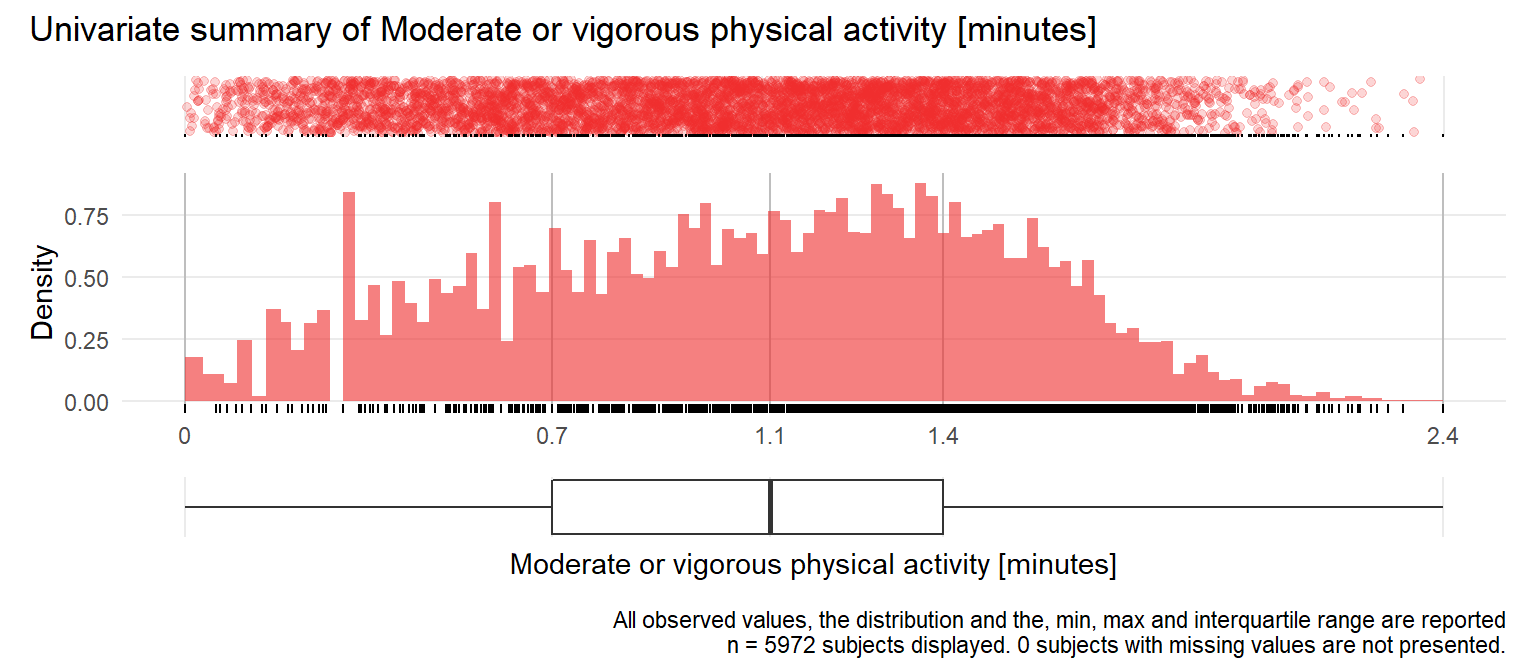
Figure 7.4: Distribution of log10 (1+MVPA)
![Distribution of wear time [minutes]](nhanes_univar_files/figure-html/unnamed-chunk-8-1.png)
Figure 7.5: Distribution of wear time [minutes]
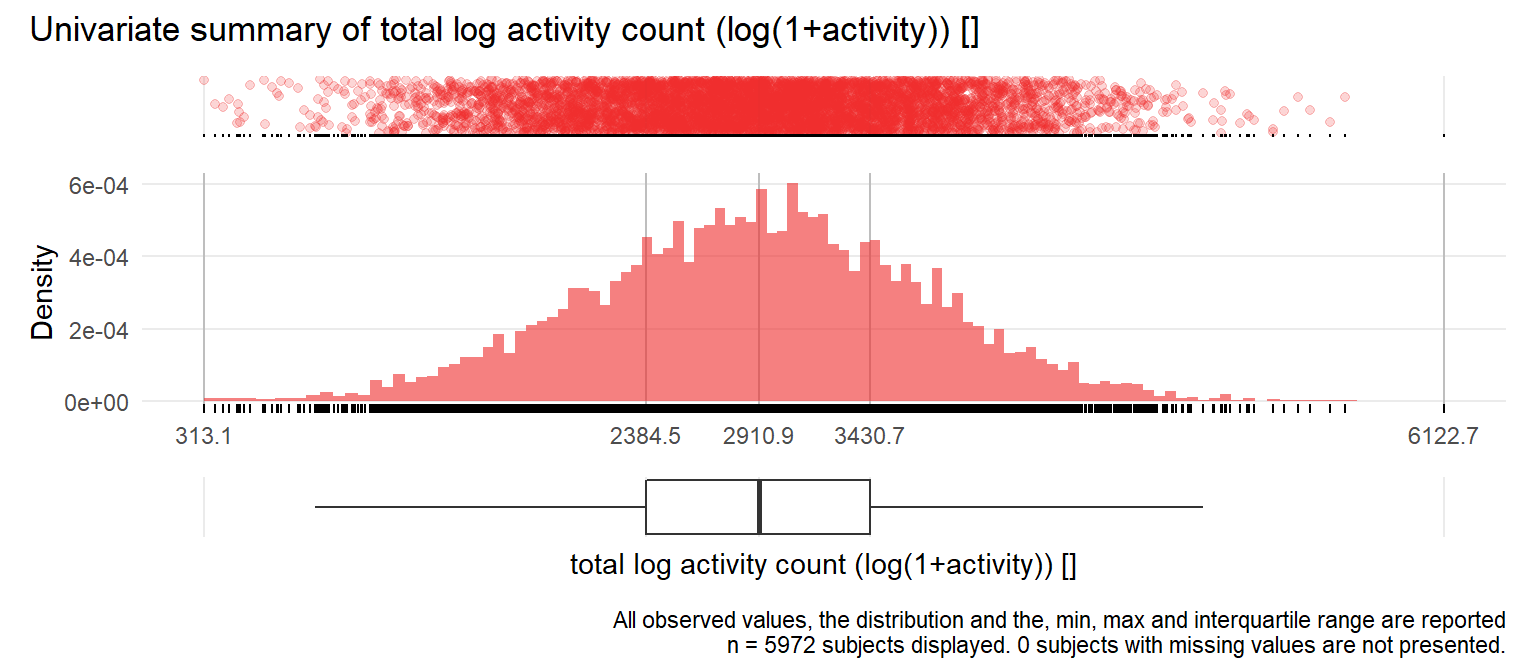
Figure 7.6: Distribution of log total activity count
12.4 Section session info
## R version 4.1.3 (2022-03-10)
## Platform: x86_64-w64-mingw32/x64 (64-bit)
## Running under: Windows 10 x64 (build 17763)
##
## Matrix products: default
##
## locale:
## [1] LC_COLLATE=English_Austria.1252  LC_CTYPE=English_Austria.1252
## [3] LC_MONETARY=English_Austria.1252 LC_NUMERIC=C
## [5] LC_TIME=English_Austria.1252
##
## attached base packages:
## [1] stats     graphics  grDevices utils     datasets  methods   base
##
## other attached packages:
##  [1] Hmisc_4.6-0     Formula_1.2-4   survival_3.2-13 lattice_0.20-45
##  [5] forcats_0.5.1   stringr_1.4.0   dplyr_1.0.8     purrr_0.3.4
##  [9] readr_2.1.2     tidyr_1.2.0     tibble_3.1.6    ggplot2_3.3.5
## [13] tidyverse_1.3.1 here_1.0.1
##
## loaded via a namespace (and not attached):
##  [1] fs_1.5.2            lubridate_1.8.0     RColorBrewer_1.1-2
##  [4] httr_1.4.2          rprojroot_2.0.2     tools_4.1.3
##  [7] backports_1.4.1     bslib_0.3.1         utf8_1.2.2
## [10] R6_2.5.1            rpart_4.1.16        DBI_1.1.2
## [13] colorspace_2.0-3    nnet_7.3-17         withr_2.5.0
## [16] tidyselect_1.1.2    gridExtra_2.3       compiler_4.1.3
## [19] cli_3.2.0           rvest_1.0.2         htmlTable_2.4.0
## [22] xml2_1.3.3          labeling_0.4.2      bookdown_0.25
## [25] sass_0.4.1          scales_1.1.1        checkmate_2.0.0
## [28] digest_0.6.29       foreign_0.8-82      rmarkdown_2.13
## [31] base64enc_0.1-3     jpeg_0.1-9          pkgconfig_2.0.3
## [34] htmltools_0.5.2     highr_0.9           dbplyr_2.1.1
## [37] fastmap_1.1.0       htmlwidgets_1.5.4   rlang_1.0.2
## [40] readxl_1.3.1        rstudioapi_0.13     jquerylib_0.1.4
## [43] generics_0.1.2      farver_2.1.0        jsonlite_1.8.0
## [46] magrittr_2.0.2      patchwork_1.1.1     Matrix_1.4-0
## [49] Rcpp_1.0.8.3        munsell_0.5.0       fansi_1.0.3
## [52] lifecycle_1.0.1     stringi_1.7.6       yaml_2.3.5
## [55] grid_4.1.3          crayon_1.5.1        haven_2.4.3
## [58] splines_4.1.3       hms_1.1.1           knitr_1.38
## [61] pillar_1.7.0        reprex_2.0.1        glue_1.6.2
## [64] evaluate_0.15       latticeExtra_0.6-29 data.table_1.14.2
## [67] modelr_0.1.8        png_0.1-7           vctrs_0.3.8
## [70] tzdb_0.2.0          cellranger_1.1.0    gtable_0.3.0
## [73] assertthat_0.2.1    xfun_0.30           broom_0.7.12
## [76] cluster_2.1.2       ellipsis_0.3.2