| Category | Count | Proportion |
|---|---|---|
| Age group | ||
| [16, 50] | 5365 | 0.37 |
| (65, 101] | 5076 | 0.35 |
| (50, 65] | 4250 | 0.29 |
| Sex | ||
| male | 8536 | 0.58 |
| female | 6155 | 0.42 |
| Presence of bacteremia | ||
| no | 13511 | 0.92 |
| yes | 1180 | 0.08 |
5 Univariate distribution checks
This section reports a series of univariate summary checks of the bacteremia dataset.
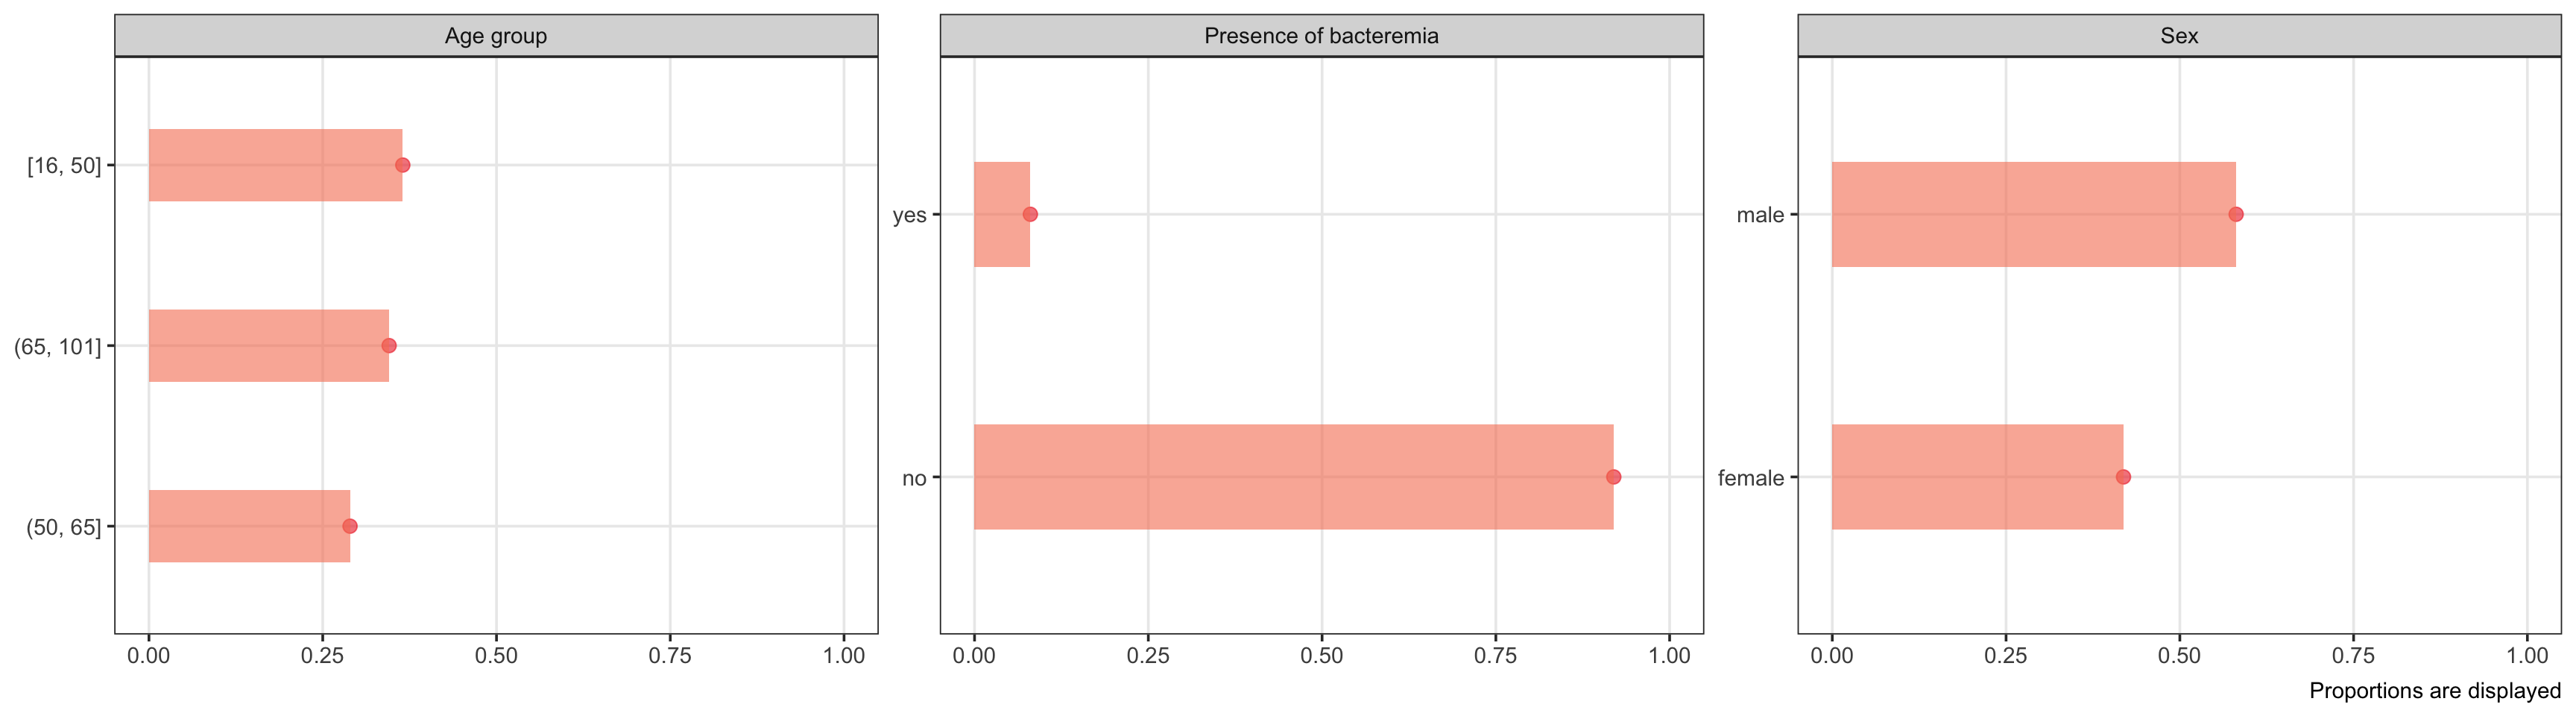
5.1 U1: Categorical variables
Age group, sex and bacteremia status are described by frequencies and proportions in each category.
Also plot the categories as simple bar charts.
5.2 Continuous variables
5.2.1 U2: Univariate distributions of continuous variables
5.2.1.1 U2: Structural variables
The only structural continuous variable is AGE. This variable is also a key predictor and reported in the following section (see below).
5.2.1.2 U2: Key predictors
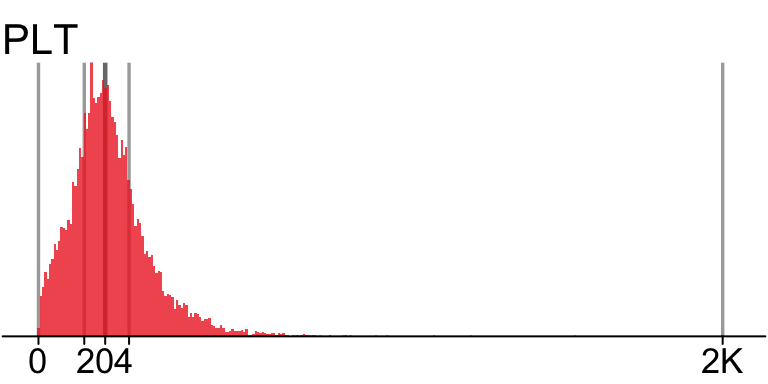
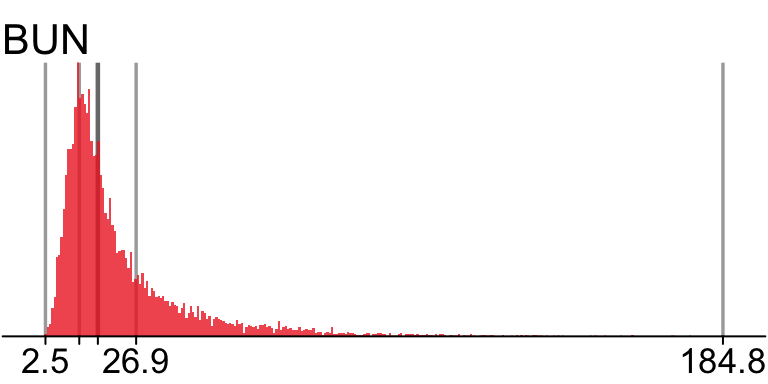
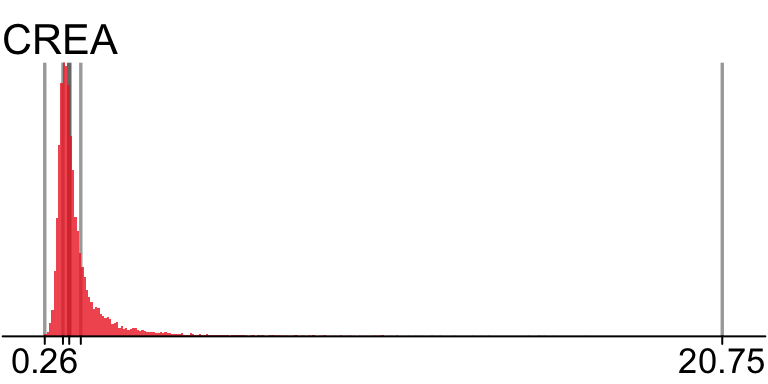
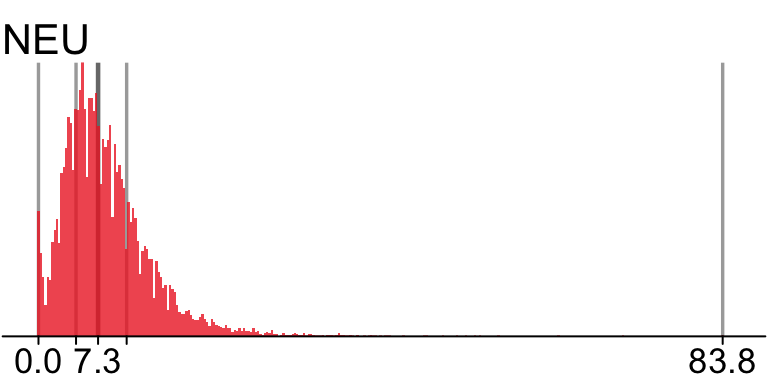
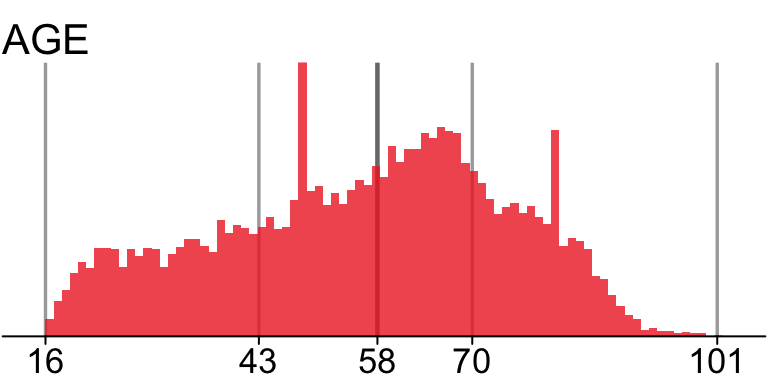
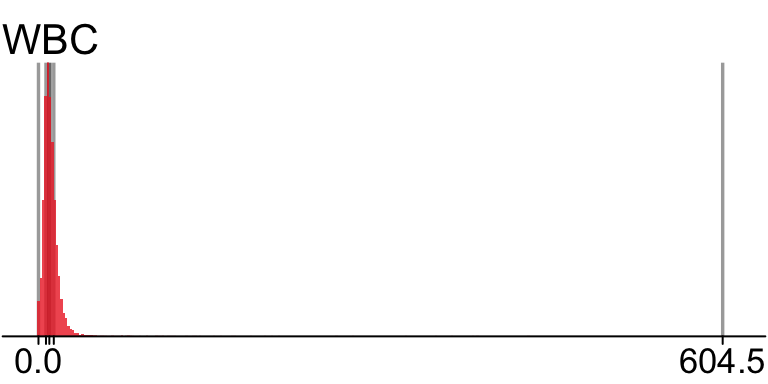
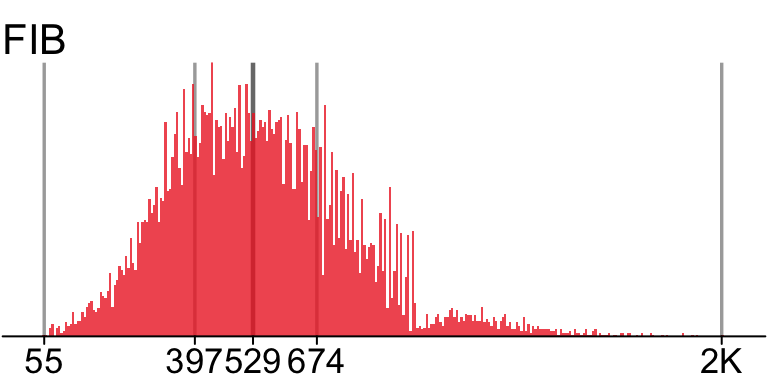
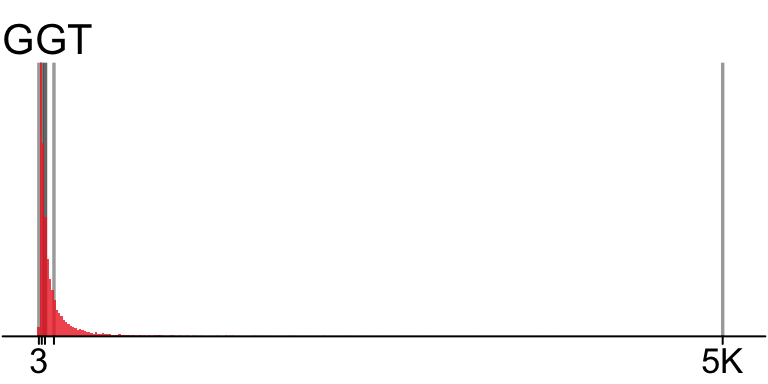
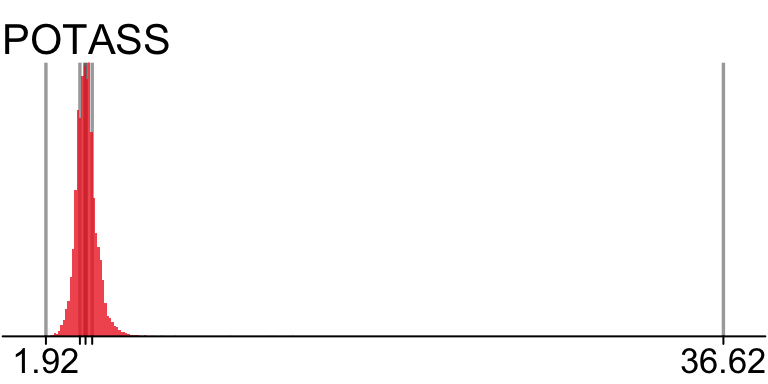
Distribution of key predictors. Lines indicate the 5-number summary including reported numerical values (where possible).
The remaining predictors are reported in the appendix Section E.1.1.
5.2.1.3 U2: Predictors of medium importance

5.2.2 Numerical summaries
5.2.2.1 Key predictors
key_predictors
6 Variables 14691 Observations
6 Variables 14691 Observations
PLT: Parameter analysis value (Numeric)

| n | missing | distinct | Info | Mean | Gmd | .05 | .10 | .25 | .50 | .75 | .90 | .95 |
|---|---|---|---|---|---|---|---|---|---|---|---|---|
| 14649 | 42 | 718 | 1 | 220 | 130.1 | 50 | 81 | 140 | 204 | 277 | 369 | 445 |
CREA: Parameter analysis value (Numeric)

| n | missing | distinct | Info | Mean | Gmd | .05 | .10 | .25 | .50 | .75 | .90 | .95 |
|---|---|---|---|---|---|---|---|---|---|---|---|---|
| 14532 | 159 | 674 | 1 | 1.329 | 0.8518 | 0.620 | 0.690 | 0.810 | 1.000 | 1.350 | 2.160 | 3.144 |
BUN: Parameter analysis value (Numeric)

| n | missing | distinct | Info | Mean | Gmd | .05 | .10 | .25 | .50 | .75 | .90 | .95 |
|---|---|---|---|---|---|---|---|---|---|---|---|---|
| 14519 | 172 | 947 | 1 | 22.66 | 16.92 | 7.1 | 8.6 | 11.6 | 16.6 | 26.9 | 44.8 | 60.8 |
NEU: Parameter analysis value (Numeric)

| n | missing | distinct | Info | Mean | Gmd | .05 | .10 | .25 | .50 | .75 | .90 | .95 |
|---|---|---|---|---|---|---|---|---|---|---|---|---|
| 13963 | 728 | 374 | 1 | 8.367 | 5.776 | 1.60 | 2.70 | 4.60 | 7.30 | 10.80 | 15.08 | 18.40 |
WBC: Parameter analysis value (Numeric)

| n | missing | distinct | Info | Mean | Gmd | .05 | .10 | .25 | .50 | .75 | .90 | .95 |
|---|---|---|---|---|---|---|---|---|---|---|---|---|
| 14229 | 462 | 2710 | 1 | 11.23 | 7.602 | 2.66 | 4.26 | 6.63 | 9.60 | 13.53 | 18.22 | 22.27 |
AGE: Parameter analysis value (Numeric)

| n | missing | distinct | Info | Mean | Gmd | .05 | .10 | .25 | .50 | .75 | .90 | .95 |
|---|---|---|---|---|---|---|---|---|---|---|---|---|
| 14691 | 0 | 85 | 1 | 56.17 | 20.78 | 24 | 29 | 43 | 58 | 70 | 79 | 84 |
5.2.2.2 Predictors of medium importance
medium_predictors
6 Variables 14691 Observations
6 Variables 14691 Observations
FIB: Parameter analysis value (Numeric)

| n | missing | distinct | Info | Mean | Gmd | .05 | .10 | .25 | .50 | .75 | .90 | .95 |
|---|---|---|---|---|---|---|---|---|---|---|---|---|
| 12124 | 2567 | 1084 | 1 | 547.4 | 231 | 247 | 301 | 397 | 529 | 674 | 816 | 892 |
POTASS: Parameter analysis value (Numeric)

| n | missing | distinct | Info | Mean | Gmd | .05 | .10 | .25 | .50 | .75 | .90 | .95 |
|---|---|---|---|---|---|---|---|---|---|---|---|---|
| 12683 | 2008 | 408 | 1 | 4.003 | 0.6004 | 3.20 | 3.39 | 3.66 | 3.95 | 4.29 | 4.67 | 4.92 |
ASAT: Parameter analysis value (Numeric)

| n | missing | distinct | Info | Mean | Gmd | .05 | .10 | .25 | .50 | .75 | .90 | .95 |
|---|---|---|---|---|---|---|---|---|---|---|---|---|
| 13537 | 1154 | 650 | 1 | 86.9 | 115.6 | 15 | 17 | 22 | 31 | 56 | 121 | 218 |
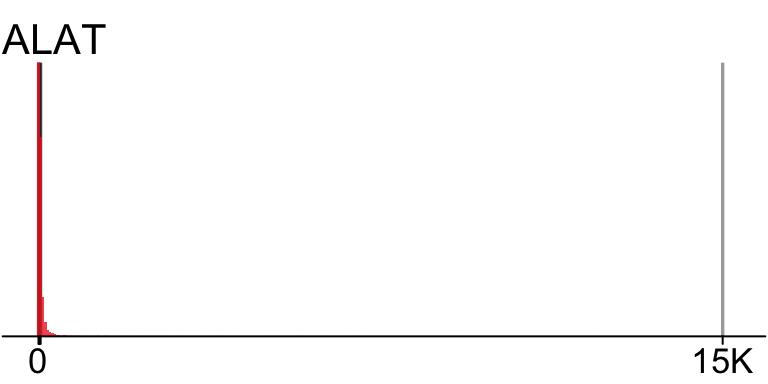
ALAT: Parameter analysis value (Numeric)

| n | missing | distinct | Info | Mean | Gmd | .05 | .10 | .25 | .50 | .75 | .90 | .95 |
|---|---|---|---|---|---|---|---|---|---|---|---|---|
| 13704 | 987 | 578 | 1 | 67.66 | 90.07 | 9 | 11 | 16 | 26 | 48 | 101 | 175 |
GGT: Parameter analysis value (Numeric)

| n | missing | distinct | Info | Mean | Gmd | .05 | .10 | .25 | .50 | .75 | .90 | .95 |
|---|---|---|---|---|---|---|---|---|---|---|---|---|
| 13429 | 1262 | 858 | 1 | 115.1 | 141.3 | 13.0 | 16.0 | 25.0 | 49.0 | 117.0 | 262.2 | 429.0 |
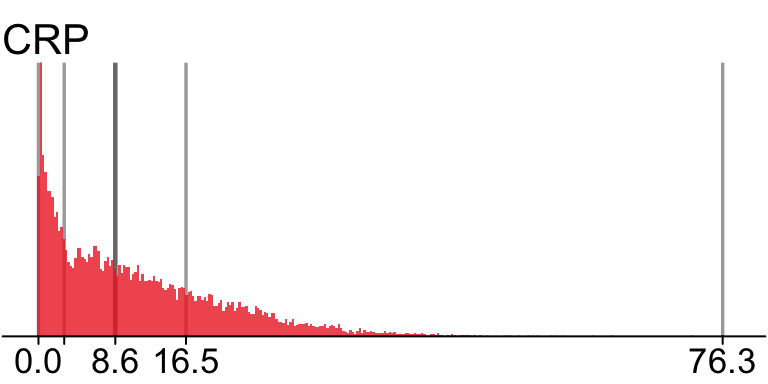
CRP: Parameter analysis value (Numeric)

| n | missing | distinct | Info | Mean | Gmd | .05 | .10 | .25 | .50 | .75 | .90 | .95 |
|---|---|---|---|---|---|---|---|---|---|---|---|---|
| 14536 | 155 | 3328 | 1 | 10.92 | 10.39 | 0.29 | 0.77 | 2.87 | 8.57 | 16.45 | 24.49 | 29.61 |
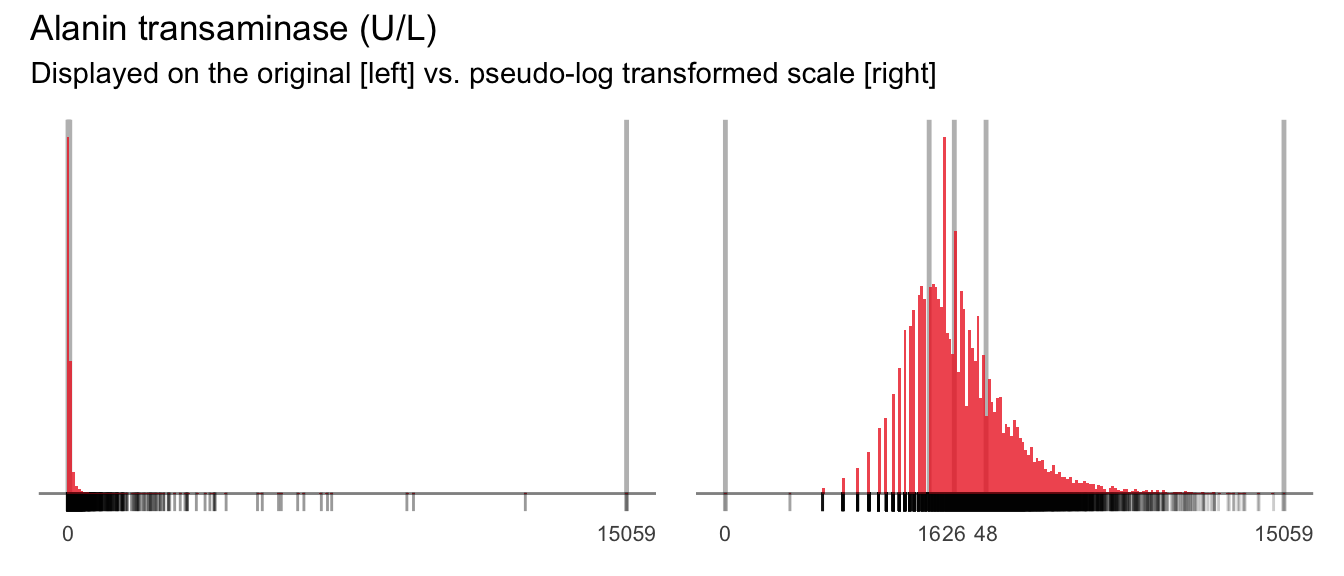
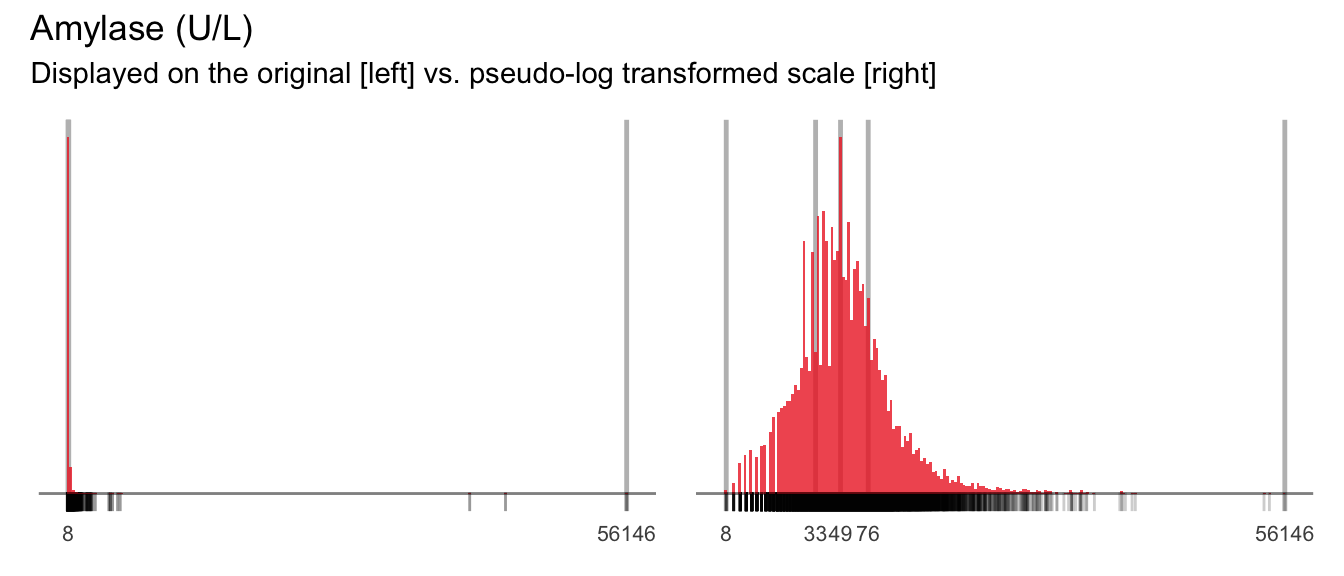
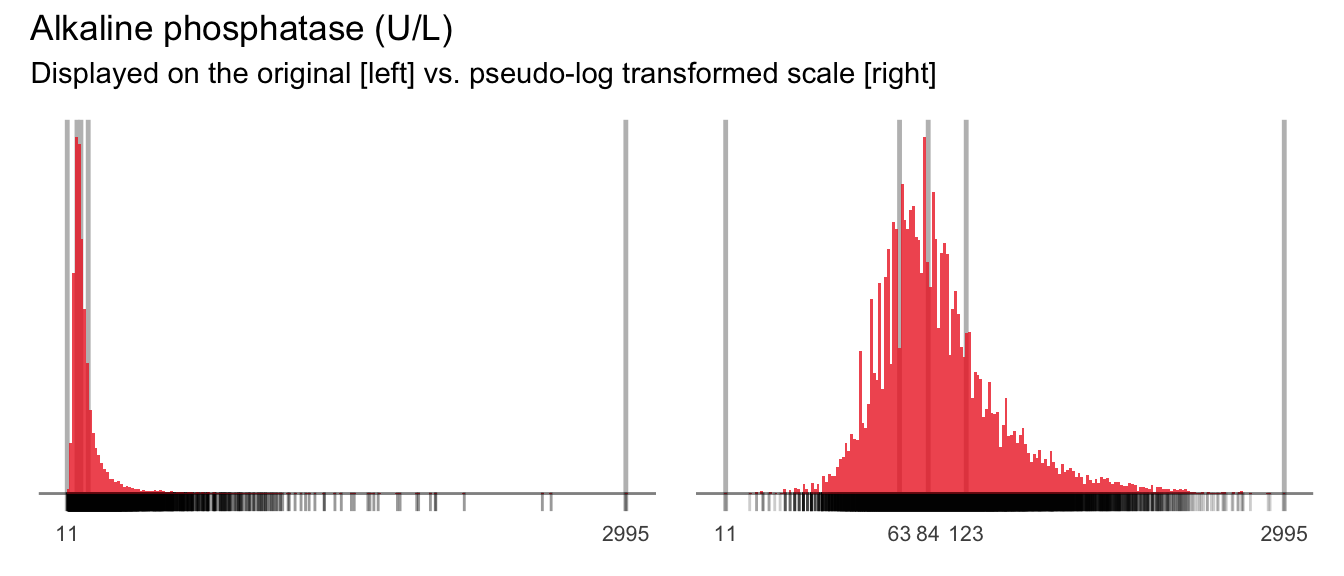
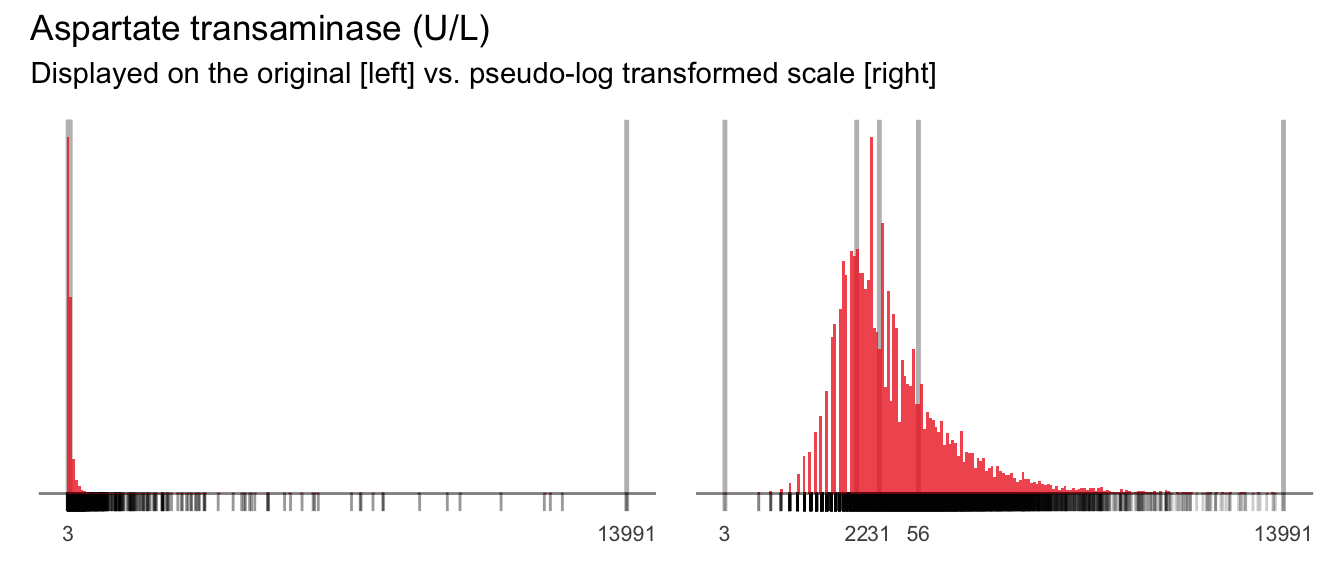
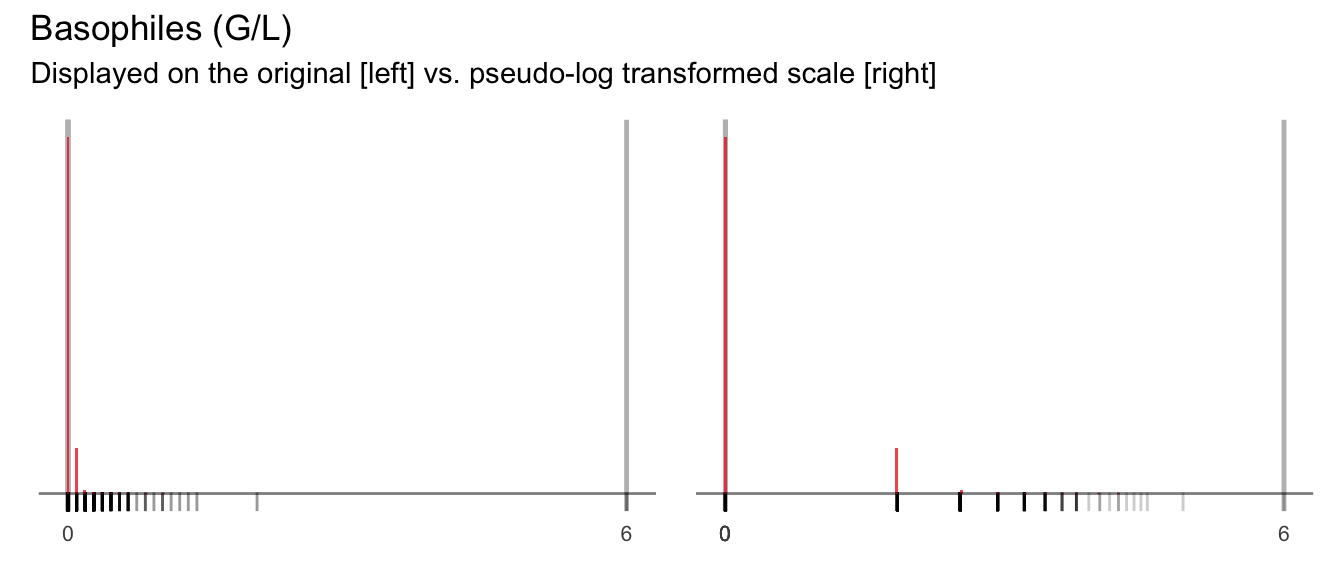
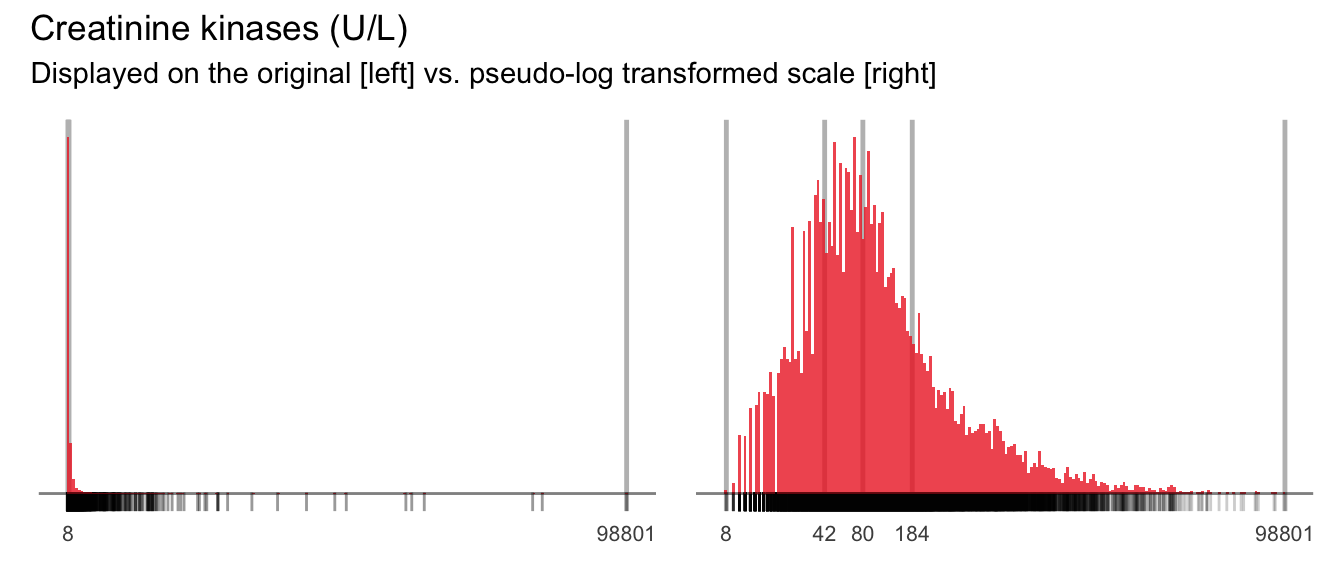
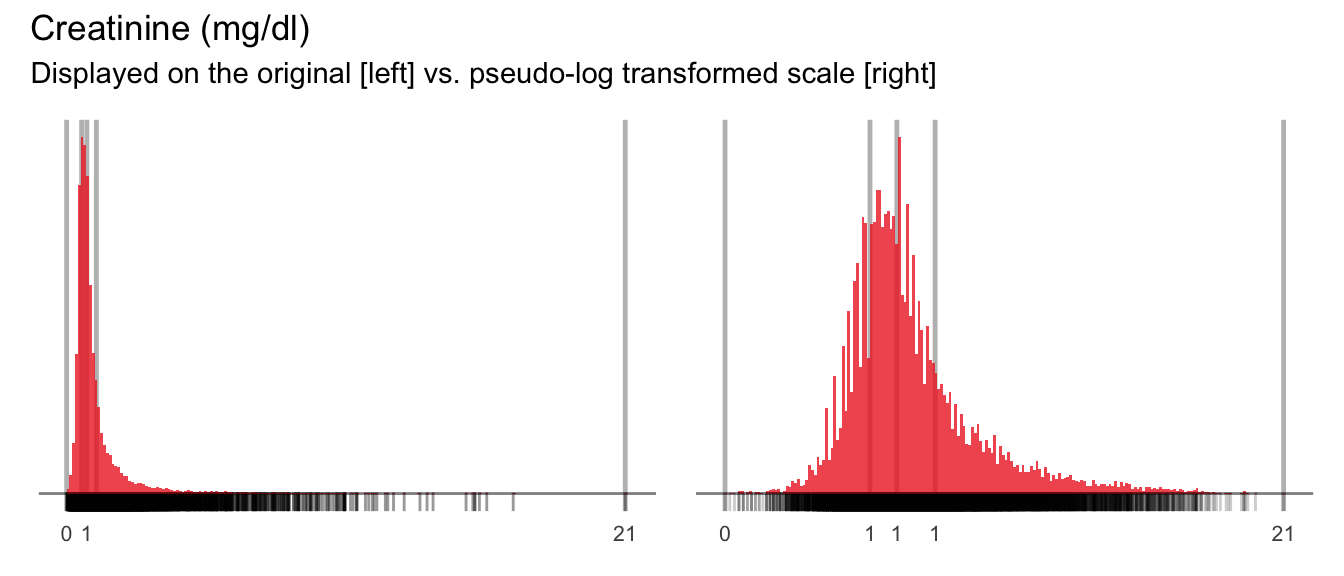
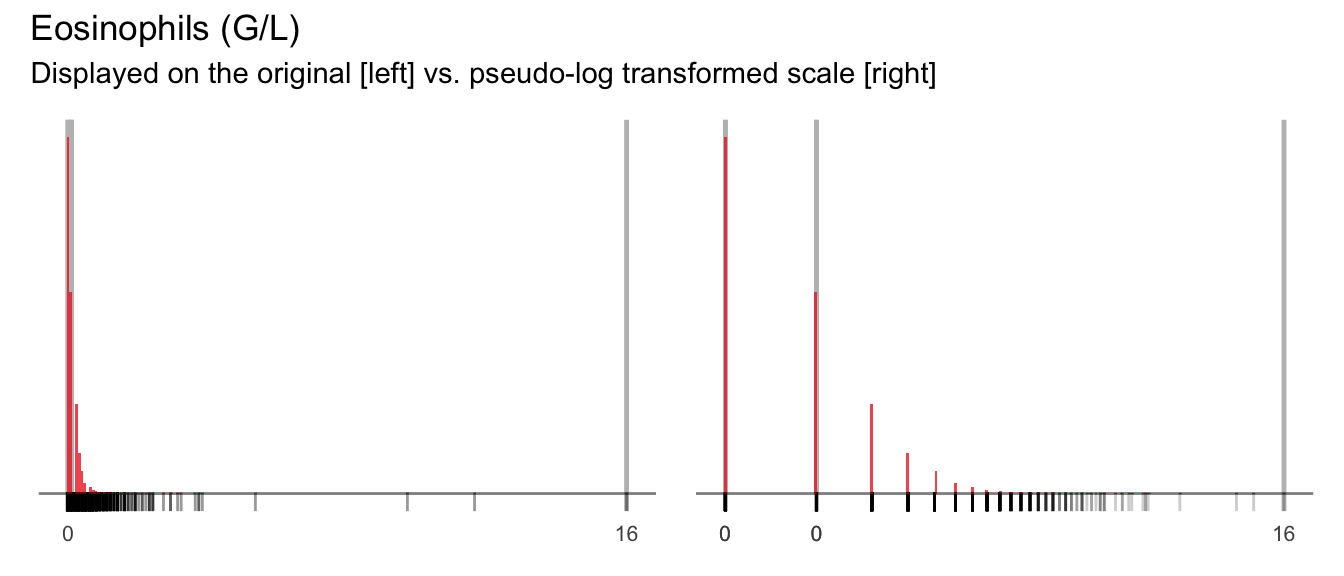
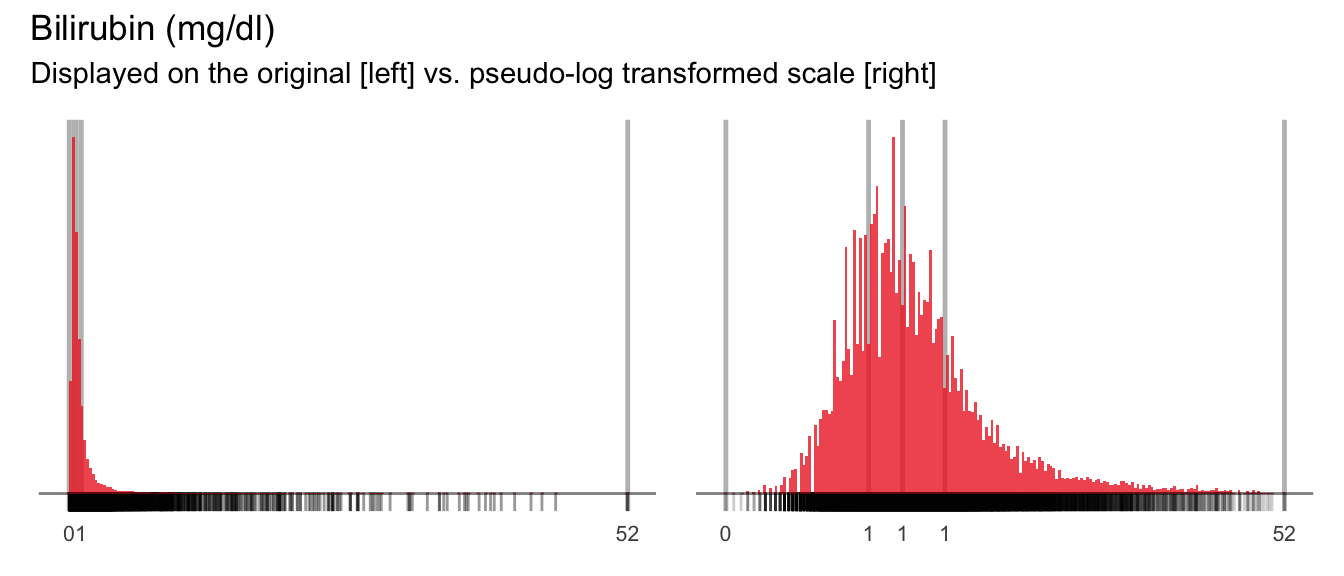
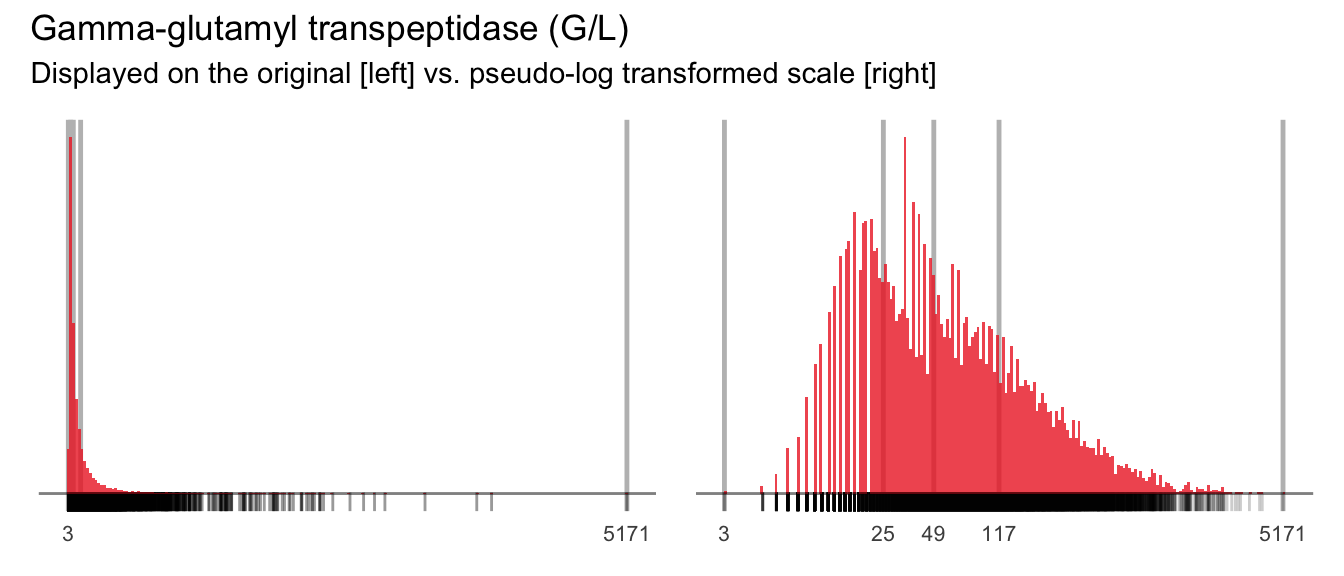
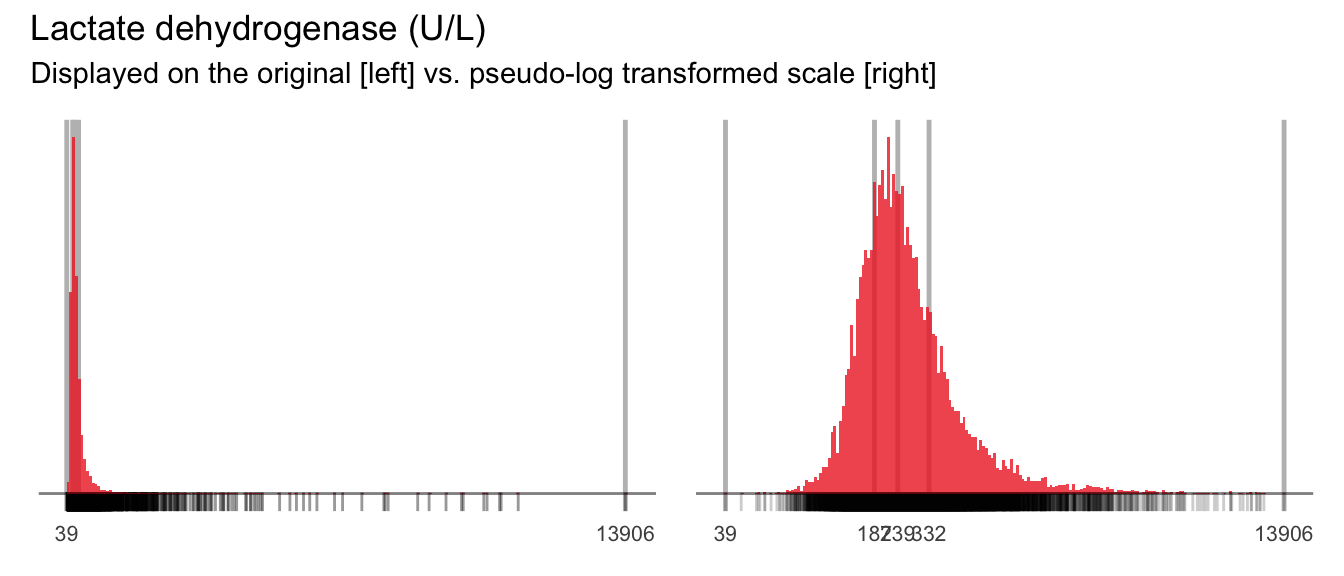
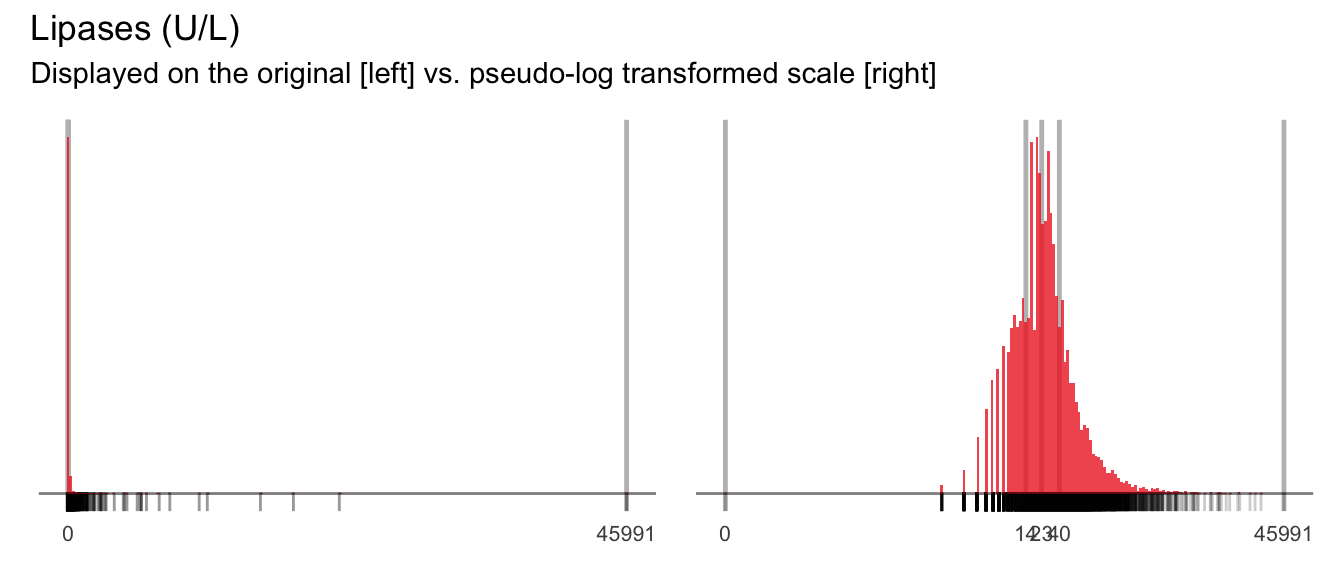
5.2.3 Suggested transformations
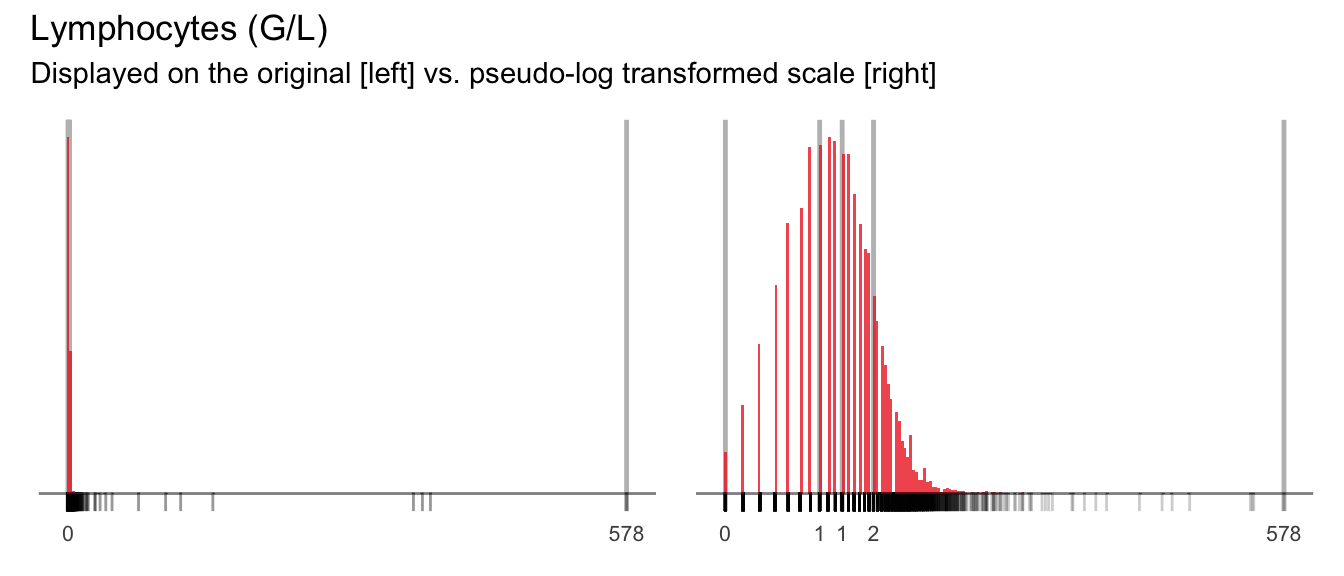
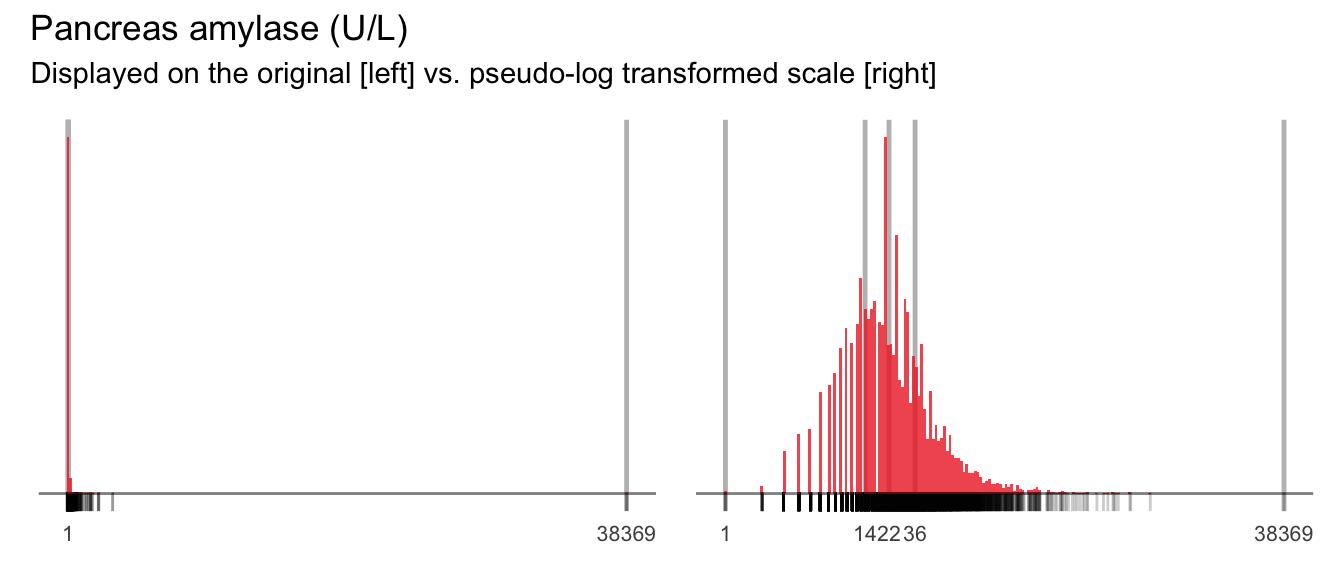
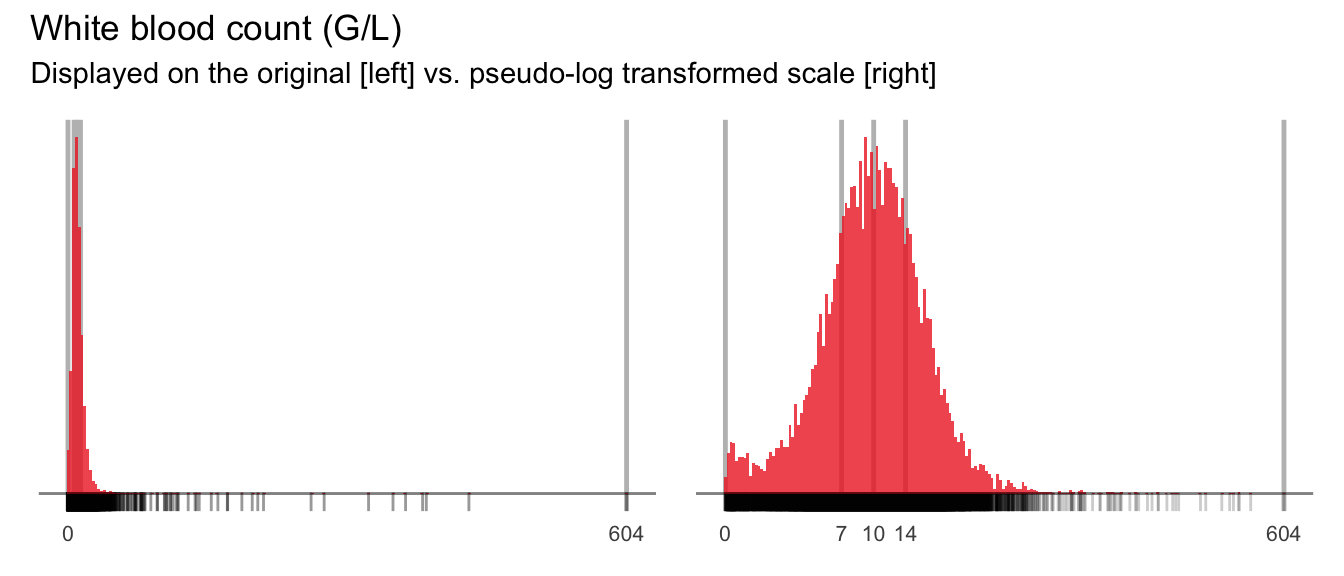
Next we investigate whether a pseudolog transformation of continuous variables may substantially symmetrize the univariate distributions of the continuous variables, and may hence be useful for multivariate summaries. We employ a function ida_trans for this purpose, which optimises the parameter sigma of the pseudo-logarithm for that purpose. The optimization targets the best possible linear correlation of the transformed values with normal deviates. If no better transformation can be found, or if the improvement in correlation is less than 0.2 correlation units, no transformation is suggested.
Display the proposed variable transformations and the new parameter codes.
| PARAMCD | n |
|---|---|
| ALAT_T | 14691 |
| AMY_T | 14691 |
| AP_T | 14691 |
| ASAT_T | 14691 |
| BASO_T | 14691 |
| CK_T | 14691 |
| CREA_T | 14691 |
| EOS_T | 14691 |
| GBIL_T | 14691 |
| GGT_T | 14691 |
| LDH_T | 14691 |
| LIP_T | 14691 |
| LYM_T | 14691 |
| PAMY_T | 14691 |
| WBC_T | 14691 |
Register transformed variables in the data set. The updated data set with suggested log transformed data sets is saved at data/IDA/ADLB_02.rds.
The IDA analysis plan and specifications are updated with the proposed variable transformations. A new flag is derived to indicate the categorization of predictors now including transformations.
5.2.4 Comparison of univariate distributions with and without pseudo-log transformation
The comparison is only shown for variables where a transformation is suggested. Note, all observed values, and the distribution min, max and interquartile range as reference lines, are displayed.